
Disclosure: WebFin is reader-supported. If you buy hosting through links on this page, we may earn a commission at no extra cost to you. Commissions vary between providers and our ratings do not — here’s our full disclosure.
Almost every guide to speeding up a website starts with a caching plugin. That is the wrong first step, because it fixes a problem you have not yet confirmed you have.
One number tells you where the problem lives. If time to first byte exceeds 400 milliseconds with caching already enabled, the bottleneck is the hosting environment, and no plugin will move it.
The Short Answer
Measure time to first byte before changing anything. Under 200 milliseconds means your server is fine and the problem is in your pages. Over 600 means your pages are almost irrelevant until the server changes.
Then work in order: hosting and caching first, the largest image second, the content network third, everything else after that. Optimizing in the wrong order is the most common reason a site stays slow after a weekend of work.
Step 1: Get a Baseline You Can Compare Against
Run the page through a speed tool and write down three numbers before touching anything.
Largest Contentful Paint should come in under 2.5 seconds. Interaction to Next Paint should be under 200 milliseconds. Cumulative Layout Shift should be under 0.1. Those are the 2026 thresholds, measured at the 75th percentile of real visitor data rather than a single lab run.
Besides, test your homepage and your most important landing page separately. They usually behave differently, and fixing the wrong one wastes the effort.
Only 42 to 45 percent of WordPress sites currently pass all three on mobile, against 65 percent for Shopify and over 83 percent for one site builder. Failing is normal. It is also a ranking disadvantage against sites that pass.
Step 2: Find Out Whether It Is the Server
This is the step most guides skip, and it decides everything after it.
Time to first byte is the gap between the browser asking and the server answering. It happens entirely at the server layer, and nothing on the page can improve it.
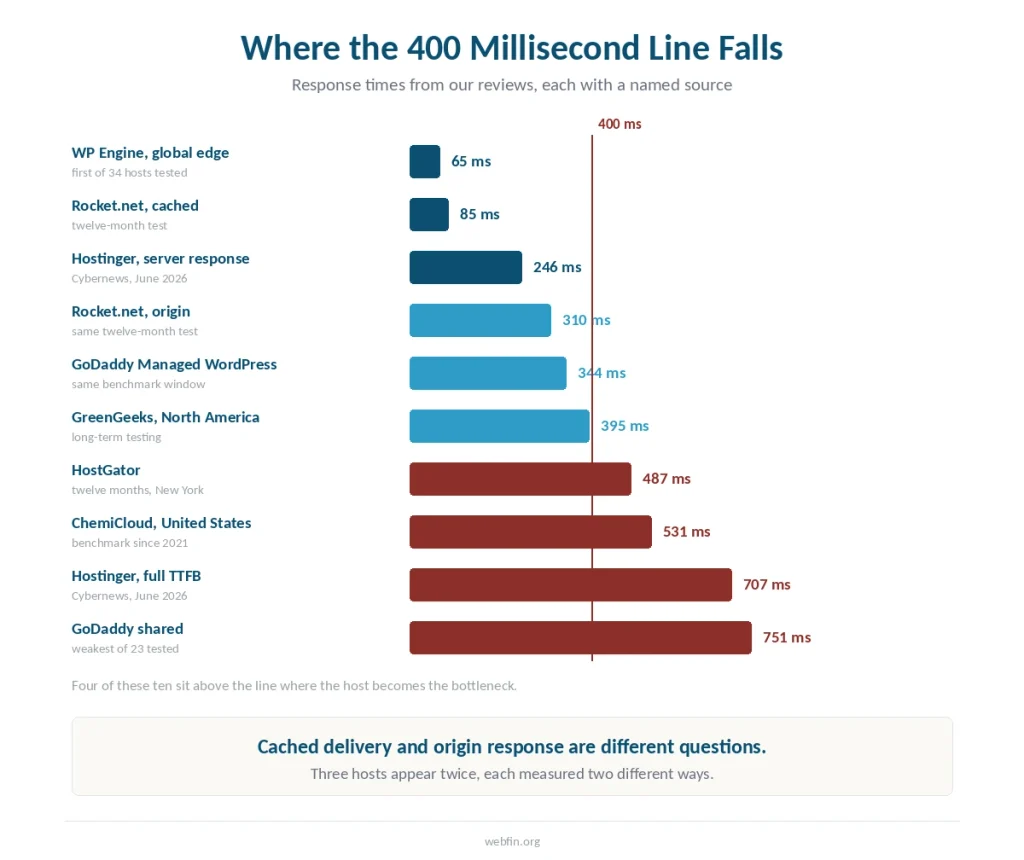
Published guidance puts the line at 800 milliseconds, above which speed tools flag it. In practice the useful threshold is lower. Above 600 milliseconds your Largest Contentful Paint will almost certainly fail whatever else you do. Above 400 with caching already on, the host is the problem.
Here is what that looks like in the hosts we have reviewed, using only figures we could attribute to a named project.
The ten figures we collected run from 65 to 751 milliseconds, and four of them sit above the 400 millisecond line — the reviews carry each source.
Step 3: Cache, and Pick the Right Plugin for Your Server
In practice, page caching alone cuts time to first byte by 60 to 80 percent on most sites. It is the single largest improvement available without changing host.
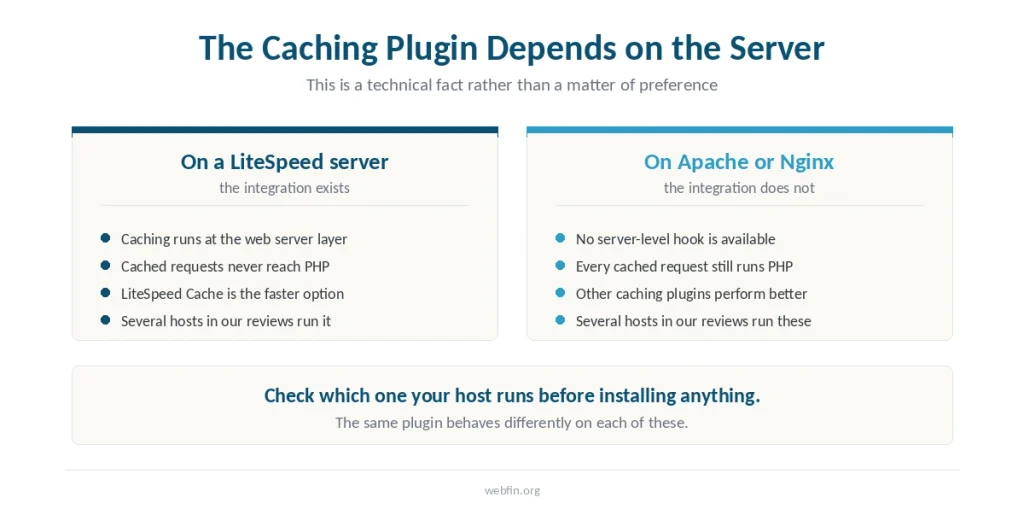
⚠️ Which plugin wins depends on what your server runs, and this is not a preference.
On LiteSpeed servers, LiteSpeed Cache operates at the web server layer and bypasses the application entirely for cached requests. On Apache or Nginx, that integration does not exist, and other caching plugins consistently perform better. If the first byte is the slow part, reducing TTFB sets out the fixes in order of cost.
Check which one your host runs before installing anything. Several hosts in our reviews run LiteSpeed and several run Apache, and the same plugin behaves differently on each.
Step 4: Fix the Largest Image
Largest Contentful Paint usually has one of three causes: an oversized hero image, a slow server, or render-blocking resources.
First, convert the image to WebP, which produces files 25 to 35 percent smaller than JPEG at the same visual quality. Add fetchpriority="high" to that image tag so the browser fetches it first.
⚠️ Do not lazy-load the image that produces your Largest Contentful Paint. Lazy loading delays exactly the element you are trying to speed up, and it is a common accident when a plugin applies it to everything.
Step 5: Understand Why Green Sites Turned Red
Interaction to Next Paint replaced First Input Delay in March 2024, and it broke scores that had been passing for years.
The old metric measured only the delay before a response began. The new one measures the whole interaction, which means heavy JavaScript from page builders now shows up where it previously did not.
Sites built with visual page builders fail this most often. The fixes are unglamorous: defer non-critical scripts, remove plugins you stopped using, and enable object caching.
What Not to Cache
Of course, cart, checkout and account pages must be excluded from page caching or they will not work.
⚠️ That exclusion has a cost people rarely calculate. Those are the pages where a visitor becomes a customer, and they reach the server every time. We found the same pattern at a host whose whole product is an enterprise content network: cached pages arrived in about 85 milliseconds while checkout hit the origin at 310.
If you run a store, the pages that matter most are the ones your caching layer never touches.
The Order That Actually Works
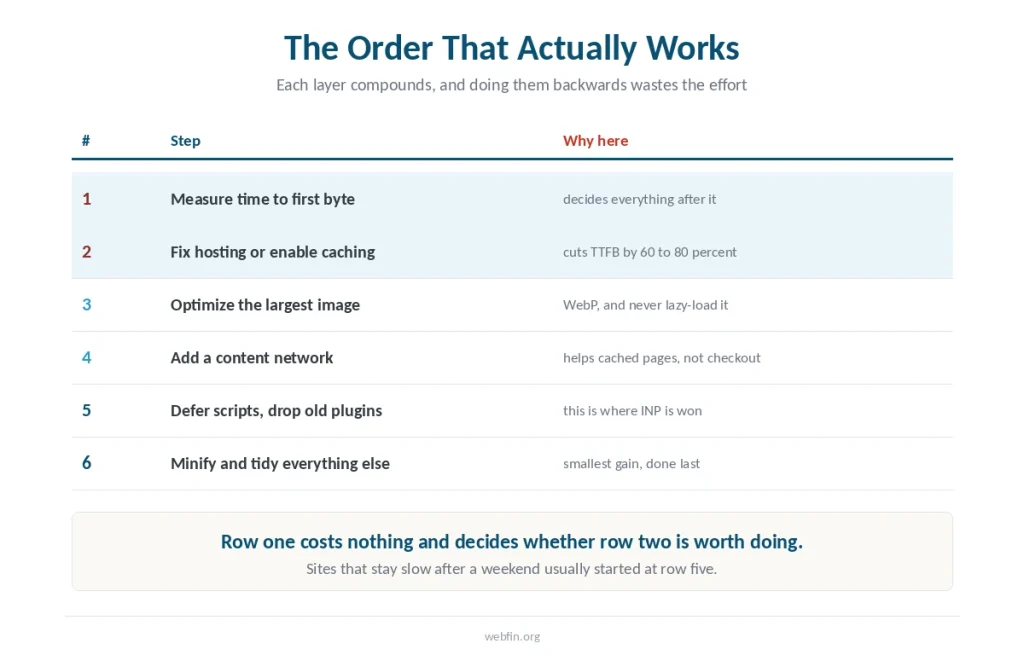
Fix hosting and caching. Optimize the image that produces your Largest Contentful Paint. Add a content network. Then work the smaller improvements.
The most common mistake is doing this backwards: deferring JavaScript while the server takes 1.2 seconds to respond, or minifying stylesheets while serving a three megabyte hero image.
Each layer compounds, and the sites that pass are the ones that did all the layers rather than the easy ones.
When the Answer Is a New Host
If time to first byte stays above 600 milliseconds with caching enabled and PHP up to date, you have reached the limit of what optimization can do.
At that point the honest options are a better plan at the same host, or a different host. Both cost money, and both are cheaper than another month of plugin configuration that cannot work — we set out what moving involves.
How We Research
Threshold figures come from published performance guidance dated 2026, and the response times come from our own reviews, where each is attributed to a named testing project with its window. We run no tests of our own, and we have not measured any site of yours.
Our criteria are on our About page.
Frequently Asked Questions
Measure time to first byte with caching already enabled. Under 200 milliseconds means the server is fine. Above 400 means the hosting environment is the bottleneck, and above 600 your Largest Contentful Paint will fail regardless of front-end work.
It depends on your server. On LiteSpeed servers, LiteSpeed Cache works at the web server layer and bypasses the application for cached requests. On Apache or Nginx that integration is unavailable, and other full-page caching plugins perform better.
Largest Contentful Paint under 2.5 seconds, Interaction to Next Paint under 200 milliseconds, and Cumulative Layout Shift under 0.1. All three are measured at the 75th percentile of real visitor data rather than from a single test.
Interaction to Next Paint replaced First Input Delay in March 2024 and measures the whole interaction rather than just the initial delay. Sites with heavy JavaScript from page builders fail the new metric while passing the old one.
No. Never lazy-load the image that produces your Largest Contentful Paint, because doing so delays the exact element the metric measures. Lazy loading helps for images below the fold and hurts for the one above it.
The Verdict
Measure first. One number separates a hosting problem from a page problem, and everything after it depends on knowing which you have.
Then work the order: server, caching, the largest image, the network, the rest. Most sites that stay slow after a weekend of effort did the last item first.