
Disclosure: WebFin is reader-supported. If you buy hosting through links on this page, we may earn a commission at no extra cost to you. Commissions vary between providers and our ratings do not — here’s our full disclosure.
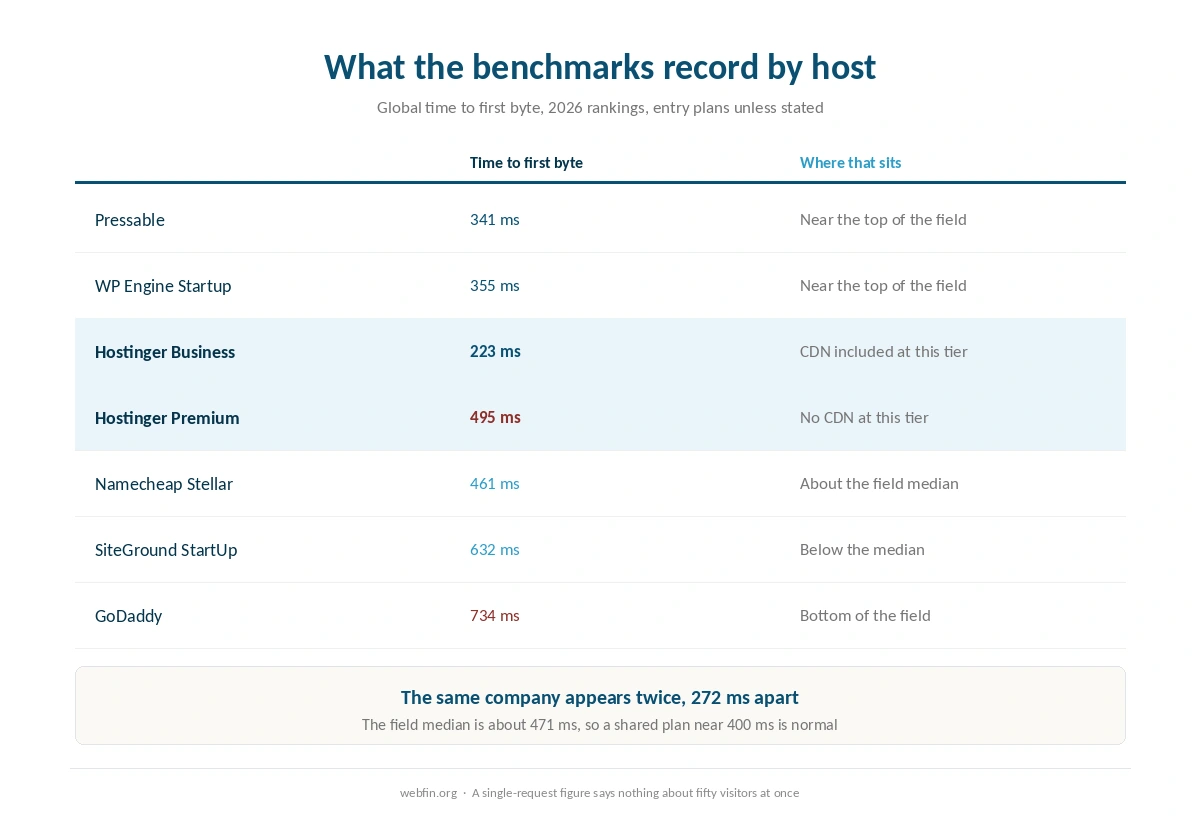
To reduce TTFB you work through four layers in order: the cache you already have, an edge network in front of it, what runs on the server before output, and finally the server itself. The order matters, because the first two are usually free and the last one is a monthly bill. Here is the fact that decides most cases. In the 2026 benchmarks Hostinger Premium answers in 495 ms and Hostinger Business answers in 223 ms. The difference between those plans is a content network, not a faster machine. If the server itself is being held back, see checking whether your host is throttling you.
How to Reduce TTFB: The Short Answer
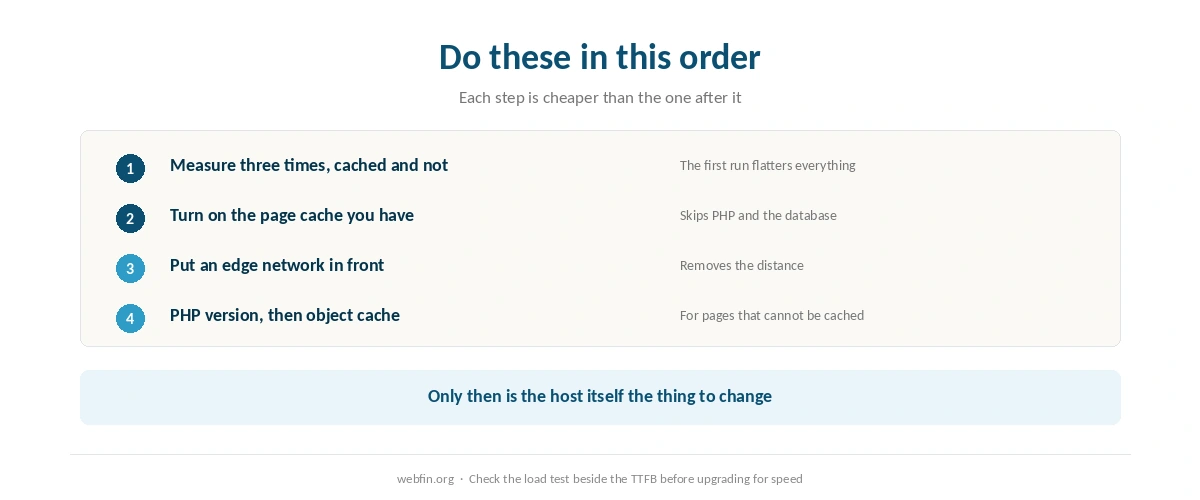
Measure the same page three times from one location, cached and uncached. Turn on your host’s page cache, then put a CDN in front of the site. Update PHP and add an object cache if pages are dynamic. Only after that does the host itself become the thing to change. Setting one up without breaking checkout is covered in how to set up a CDN.
What TTFB Actually Measures
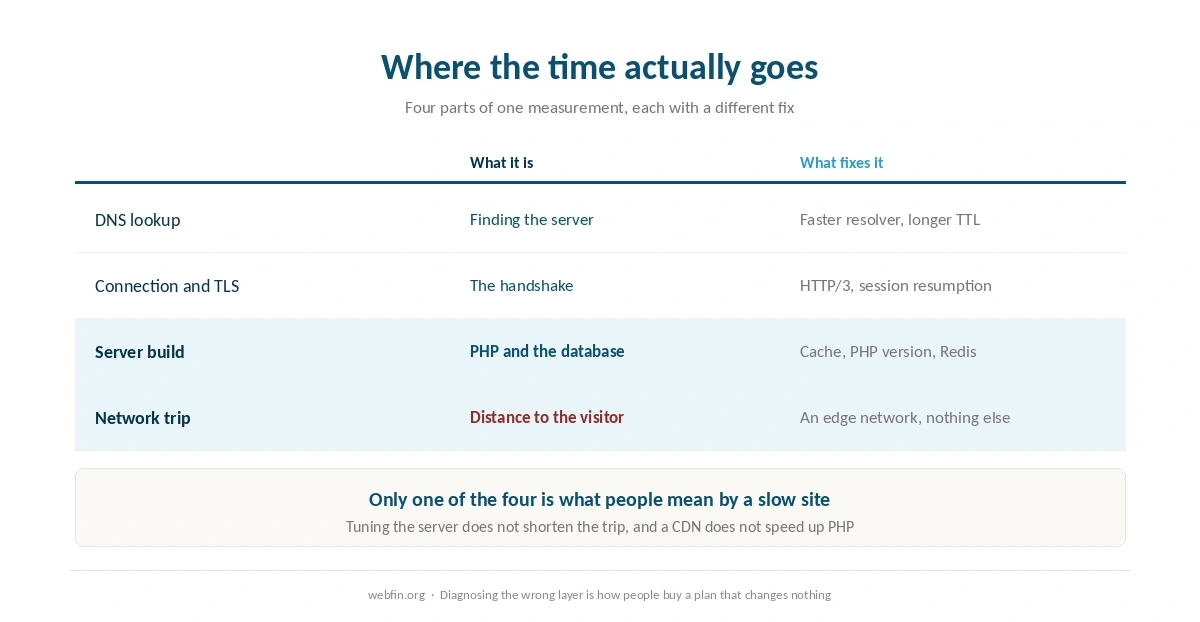
Time to first byte is the gap between the request leaving the browser and the first byte of the response arriving. It contains four things: the DNS lookup, the connection and TLS handshake, whatever the server does to build the page, and the network trip each way. Only the third is what most people mean when they blame WordPress.
That matters because the fixes live in different places. A slow handshake is a network and certificate problem. The build itself is PHP, database and plugins. Distance is the part no amount of server tuning shortens. Diagnosing the wrong layer is how people end up paying for a faster plan that changes nothing.
⚠️ TTFB is a single-visitor measurement. A server can answer one request in 200 ms and collapse under fifty at once, which is exactly what the benchmarks record for some entry plans. Treat it as one number among several rather than the score. When the question is many visitors at once rather than one, see the best hosting for high traffic.
Step 1: Measure It Properly
Load the page three times from the same location before you record anything. The first run warms the cache. Quoting it is the commonest reason people think a change helped when it did not. Test an uncached URL as well, because a cached homepage says nothing about a cart or a search result. The emergency version of this is how to handle a traffic spike.
Field data beats lab data when you can get it. Lab tools measure from a data center with a clean connection, and real visitors have neither. Say your audience sits on mobile networks a continent away. Then a 200 ms reading from a nearby test server is a flattering fiction. Measuring it properly first is covered in testing your site speed properly.
Step 2: Turn On the Cache You Are Already Paying For
Most hosts ship a page cache and leave it off, or on at a setting that misses logged-in traffic. Enabling it is the largest free win in this list, because a cached response skips PHP and the database entirely.
Check the exclusions after you enable it. Cart, checkout and account pages must stay uncached. A cache that serves a stale cart to the wrong visitor is worse than a slow one. Our guide to speeding up a slow website covers the layers that sit above this one.
Step 3: Put an Edge Network in Front
A CDN answers from a location near the visitor rather than from your server, which removes the part of TTFB that tuning cannot touch. This is where the Hostinger numbers come from: the same company, two plans, 495 ms and 223 ms, with the network as the difference. Our Hostinger review prices both tiers.
Before you buy one, check whether your plan already includes it. SiteGround, ChemiCloud and several others bundle a network at every tier, and hosts that sell it as an upgrade usually say so on the plan page. Paying twice for edge caching is common, because the feature list and the dashboard rarely use the same word. Our SiteGround review notes which tiers bundle it.
Step 4: Update PHP and Add an Object Cache
PHP version is free performance that people leave on the table for years. Each release runs the same code faster, and hosts keep old versions available for compatibility rather than because they are a good idea. Move up one version at a time on staging, which our guide to setting up a staging site explains.
An object cache matters when pages cannot be cached whole. Redis or Memcached keeps the results of repeated database queries in memory, which is what a store or a membership site spends its server time on. Most managed hosts offer one, and most shared plans do not. Stores feel this more than anyone, which is why our list of WooCommerce hosting weighs it.
Step 5: Find Out What Runs Before Output
Every plugin that hooks into the start of a request adds to TTFB whether or not it prints anything. Security scanners, analytics that phone home and related-post queries are the usual suspects. Disable them one at a time on staging. Measure between each, because turning five off together tells you nothing.
The database deserves its own look. A table of expired transients or a query without an index adds hundreds of milliseconds, and neither shows up in a plugin list. That is where a slow site stops being a hosting question and becomes a maintenance one.
Step 6: Decide Whether the Host Is the Floor
Every server has a floor below which no plugin work reaches. The 2026 benchmarks put the leaders near 340 ms, the median around 471 ms, and several familiar names well above that. SiteGround records 632 ms, HostGator 580 ms and GoDaddy 734 ms, and HostGator is a Newfold Digital brand. If your uncached, un-CDN-ed pages already sit near your host’s recorded figure, you have finished the free work.
Read the load result beside the TTFB before you act. One entry plan in those benchmarks failed the concurrency test with a 65.4% error rate while posting a mid-field 480 ms on a single request. A host that answers quickly once but not fifty times is a different problem from a slow one. Our page on hosting renewal prices is worth opening before any upgrade, because the tier that fixes this renews at a different number than it advertises.
| Host | Measurement | Source and date |
|---|---|---|
| WP Engine | Global TTFB 65 ms, 1st of 34 hosts | Hostingstep, 2025 ranking, 40 locations |
| WP Engine | US TTFB 365 ms across 22 locations | Hostingstep, 2025 ranking |
| WP Engine | TTFB 355 ms, 349,920 checks | Hostingstep, Oct 2025 – May 2026 |
| WP Engine | Uptime 99.976%, 10th of 14 managed hosts | Study of 14 managed hosts, 2026 |
| WP Engine | Load 27 ms at 0% errors | Hostingstep, 2026 benchmarks |
| Rocket.net | Cached TTFB 85 ms globally | 12-month test, Mar 2025 – Mar 2026 |
| Rocket.net | Origin TTFB 310 ms; checkout bypasses cache | Same 12-month test |
| Rocket.net | Uptime 99.97%, seven outages in the window | Hostingstep, Oct 2025 – May 2026 |
| Rocket.net | Hardware score fell 8.5 → 7.5; not recommended | Hostingstep, 2026, tracked since Oct 2020 |
| Hostinger Business | Global TTFB 223 ms, 5th of 34 hosts | Hostingstep, 2026 |
| Hostinger Premium | Global TTFB 495 ms, 28th of 34; no CDN | Hostingstep, 2026 |
| Hostinger | TTFB 707 ms; server response 246 ms | Cybernews, June 2026 |
| Hostinger | Uptime 99.99%, 33 min down in 2025 | Hostingstep, continuous since 2021 |
| Hostinger | Uptime 99.93%, 6-month window | HostPro Reviews, 2026 |
| Hostinger | LCP 0.607 s, 2nd of 15 hosts | TechRadar, 10-week window, 2026 |
| Bluehost | Hardware score 9.6 of 10 | Hostingstep, 2026 |
| Bluehost | Load 41 ms at 0% errors after the Oracle move | Hostingstep changelog, 9 Jul 2026 |
| Bluehost | Response 411 ms; uptime 99.99% across 9 outages | Hostingstep, Nov 2025 – Aug 2026 |
| Bluehost | Global TTFB 224 ms across 40 locations, cached | Hostingstep Bluehost review, Jul 2026 |
| HostGator | Global TTFB 1.23 s; uptime 99.68%; 762 ms at 500 users | Hostingstep HostGator review, 2026 |
| HostGator | Hardware joint-highest in the field after the Oracle move | Hostingstep, 1 Sep 2026 update |
| ChemiCloud | US TTFB 531 ms; global 460 ms | Hostingstep, Oct 2025 – May 2026 |
| ChemiCloud | Load 1,068 ms at a 4.2% error rate | Hostingstep, same window |
| ChemiCloud | Uptime 99.76%; overall 6.1 of 10, degrading | Hostingstep, tracked since 2021 |
| GoDaddy shared | TTFB 751 ms; load test did not complete | Hostingstep, Nov 2025 – Jun 2026 |
| GoDaddy shared | Uptime 99.76% | Hostingstep, Nov 2025 – Jun 2026 |
| GoDaddy Managed WordPress | TTFB 344 ms; hardware 3.8 of 10 | Hostingstep, 2026 |
| GreenGeeks | TTFB 395 ms North America, 447 ms Europe | Long-term independent testing, 2026 |
| GreenGeeks | TTFB 580–610 ms Asia and Australia | Same testing window |
| GreenGeeks | Load 26 ms at 0% errors; WPBench 5.0 of 10 | Hostingstep, 2026 |
| GreenGeeks | 25 outages in the window; no integrated CDN found | Hostingstep, 2026 |
| Kinsta | Origin TTFB 525 ms; edge figures differ | Hostingstep, 2026 |
| Kinsta | Load 40 ms at 0% errors; WPBench 8.8 of 10 | Hostingstep, 2026 reviews |
| DreamHost | TTFB 450–500 ms band | Hostingstep, 2026 benchmarks |
| Scala Hosting | Uptime 99.97% across twelve months | Live site, 40,000 monthly visitors, UptimeRobot |
| Scala Hosting | 29 ms at the 95th percentile, 50 users | k6 load test, 2026 |
| InterServer | Uptime 99.98% across eighteen months | Six production sites, UptimeRobot |
| InterServer | Load under 700 ms; under 1.5 s by another source | Two 2026 reviews |
| A2 Hosting | TTFB 150–198 ms | 2026 studies; LiteSpeed on Turbo tiers |
| IONOS | Global TTFB 480 ms; WPBench 7.2 of 10 | Hostingstep, 2026 benchmarks |
| IONOS | Uptime 99.99%; load test failed at 65.4% errors | Hostingstep, 2026 benchmarks |
| Namecheap | TTFB 461 ms; global 448 ms; WPBench 5.0 | Hostingstep, Q4 2025; monitoring paused 30 Jun 2026 |
| InMotion | TTFB 300–500 ms shared | Published measurement, 2026 |
| InMotion | Uptime 99.97–99.99%; one account near 99.5% | Several 2026 sources |
| Hostwinds | No independent measurement found | 99.9999% is the company's own claim |
| Liquid Web | Not covered by the benchmarks we cite | VPS and dedicated are outside their scope |
| SiteGround | TTFB 632 ms; 22nd of 34 hosts | Hostingstep, 2026 benchmarks |
| SiteGround | Uptime 99.96% in 2025; 193 min over 44 outages | Hostingstep, full year 2025 |
| SiteGround | WPBench 8.4 of 10; load 170 ms at 0% errors | Hostingstep, Oct 2025 – May 2026 |
| Scala Hosting | TTFB 465 ms; global 501 ms | Hostingstep, 2026 benchmarks |
| Scala Hosting | WPBench 8.8 of 10; load 48 ms at 0% errors | Hostingstep, 2026 benchmarks |
| Scala Hosting | Uptime 99.98% across the year | Hostingstep, 2026 benchmarks |
| Cloudways | Vultr HF: load 288 ms at 1.7% errors; WPBench 7.6 | Hostingstep Cloudways review, 2026 |
| Cloudways | Uptime 99.996% to 99.999% across five plans | Hostingstep, Oct 2025 – May 2026 |
What to Do If It Does Not Work
Fast near you, slow elsewhere. The network trip is the problem, not the server. Add an edge network or move the origin closer to the audience.
Fast when cached, slow when not. The build is the problem. Look at PHP version, object cache and the plugins that run on every request.
Fine alone, terrible when busy. You are hitting a resource limit. This is the case where the plan is genuinely the answer, and where a load test result tells you more than any TTFB figure. Before you pay, price the third year in what web hosting costs.
Good in the lab, poor for real visitors. Your test location is not your audience. Re-measure from where people actually are before spending anything.
How We Research
We run no speed tests of our own. Every figure here comes from Hostingstep’s 2026 benchmarks, which monitor purchased accounts and publish the window each reading covers. Prices come from the providers’ own pages, read on 20 September 2026, and they are renewal prices unless labeled otherwise.
Where a host appears twice in a ranking under different plans, we say which plan the figure belongs to, because quoting the fast tier beside the cheap tier’s price is the commonest error in this category. The criteria behind our scores are on our about page, and the plan-level detail sits in our WP Engine review and the rest of the reviews.
TTFB FAQ
Under 200 ms is excellent and under 500 ms is workable for most sites. The 2026 benchmarks put the leading hosts near 340 ms and the field median around 471 ms, so a shared plan answering in 400 ms is normal rather than broken.
It fixes the part caused by distance, which is often the largest part. The same benchmarks record Hostinger Premium at 495 ms and Hostinger Business at 223 ms, and a content network is what separates those two plans. Check whether your tier already includes one.
No. Some upgrades buy more memory and processor, which helps under load rather than on a single request. If your pages are already cached and served from an edge, a bigger plan can change the invoice without changing the measurement.
Three runs from the same location, then repeat on an uncached URL. The first run warms the cache and flatters the result. Testing a cached homepage only is why people report improvements that their visitors never see.
No. TTFB is when the response starts, and page speed is when the content is usable. A site can answer in 150 ms and still take four seconds to render if images and scripts are heavy, which is a separate piece of work entirely.
The Verdict
Work the free layers first, in order, and measure between each one. Cache, then edge, then PHP and object cache, then the plugins that run before output. Most sites finish that list somewhere in the mid-400s in milliseconds, which is where the field median sits and where the difference stops being visible to a visitor.
Change hosts when the floor is the problem and not before. The number to check is not the one on the marketing page but the one the benchmarks record for the plan you would actually buy, at the price it renews at. If you get there, our guide to migrating web hosting covers the move, and our roundup of the best WordPress hosting lists what each plan records.