
Disclosure: WebFin is reader-supported. If you buy hosting through links on this page, we may earn a commission at no extra cost to you. Commissions vary between providers and our ratings do not — here’s our full disclosure.
The IONOS uptime record stands at 99.99%, according to Hostingstep’s 2026 tests, which works out to about 53 minutes of downtime a year. Moreover, speed and load tests add context.
Below, therefore, we cover availability, response time and behavior under traffic.
IONOS Uptime: The Short Answer
In short, IONOS uptime of 99.99% means about 53 minutes of downtime a year. In addition, the speed and load results add the rest.
IONOS Uptime and Speed Figures
| Measure | Result | Source |
|---|---|---|
| Uptime | 99.99% | Hostingstep |
| Global TTFB | 480 ms | Hostingstep |
| WPBench | 7.2 of 10 | Hostingstep |
| Load test | Failed at 65.4% errors | Hostingstep |

Uptime in Hours, Not Percentages
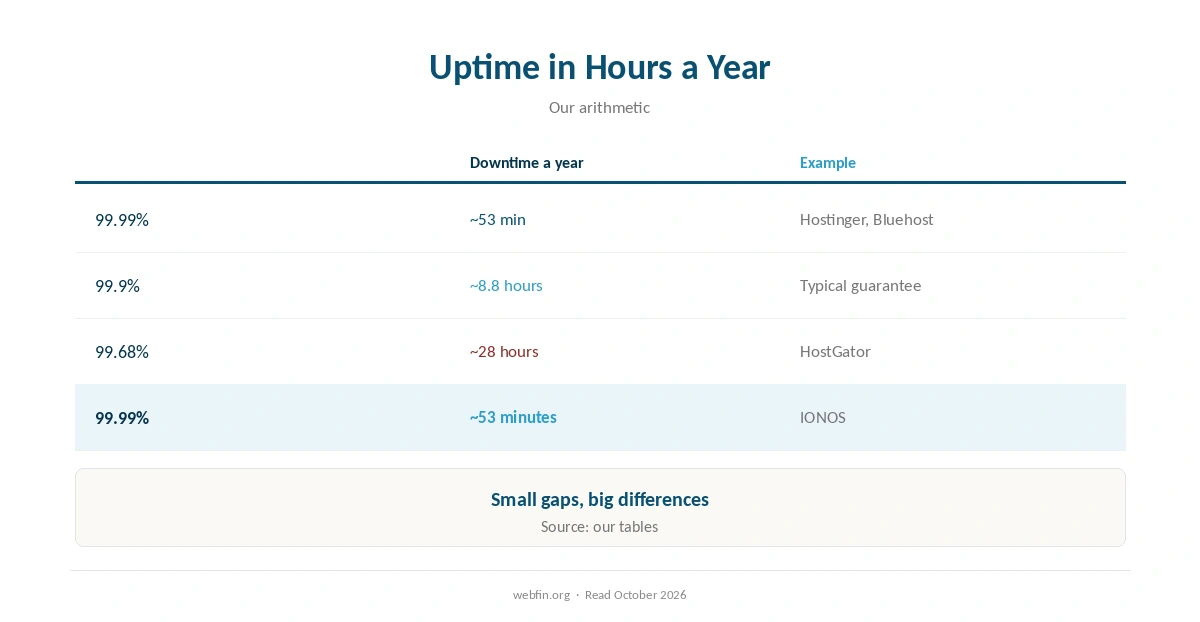
Specifically, 99.99% uptime equals about 53 minutes of downtime over a year. For reference, the common 99.9% guarantee allows about 8.8 hours.
For what hosts promise, see our guide to the uptime guarantee.
How Fast IONOS Responds
Notably, its 480 ms global TTFB and WPBench score of 7.2 of 10 are respectable for a budget host. Therefore ordinary traffic is not the problem.
As a benchmark, Google’s TTFB guidance rates 0.8 seconds or less as good.
If response is slow, our guide to reducing TTFB helps.
| Host | Measurement | Source and date |
|---|---|---|
| WP Engine | Global TTFB 65 ms, 1st of 34 hosts | Hostingstep, 2025 ranking, 40 locations |
| WP Engine | US TTFB 365 ms across 22 locations | Hostingstep, 2025 ranking |
| WP Engine | TTFB 355 ms, 349,920 checks | Hostingstep, Oct 2025 – May 2026 |
| WP Engine | Uptime 99.976%, 10th of 14 managed hosts | Study of 14 managed hosts, 2026 |
| WP Engine | Load 27 ms at 0% errors | Hostingstep, 2026 benchmarks |
| Rocket.net | Cached TTFB 85 ms globally | 12-month test, Mar 2025 – Mar 2026 |
| Rocket.net | Origin TTFB 310 ms; checkout bypasses cache | Same 12-month test |
| Rocket.net | Uptime 99.97%, seven outages in the window | Hostingstep, Oct 2025 – May 2026 |
| Rocket.net | Hardware score fell 8.5 → 7.5; not recommended | Hostingstep, 2026, tracked since Oct 2020 |
| Hostinger Business | Global TTFB 223 ms, 5th of 34 hosts | Hostingstep, 2026 |
| Hostinger Premium | Global TTFB 495 ms, 28th of 34; no CDN | Hostingstep, 2026 |
| Hostinger | TTFB 707 ms; server response 246 ms | Cybernews, June 2026 |
| Hostinger | Uptime 99.99%, 33 min down in 2025 | Hostingstep, continuous since 2021 |
| Hostinger | Uptime 99.93%, 6-month window | HostPro Reviews, 2026 |
| Hostinger | LCP 0.607 s, 2nd of 15 hosts | TechRadar, 10-week window, 2026 |
| Bluehost | Hardware score 9.6 of 10 | Hostingstep, 2026 |
| Bluehost | Load 41 ms at 0% errors after the Oracle move | Hostingstep changelog, 9 Jul 2026 |
| Bluehost | Response 411 ms; uptime 99.99% across 9 outages | Hostingstep, Nov 2025 – Aug 2026 |
| Bluehost | Global TTFB 224 ms across 40 locations, cached | Hostingstep Bluehost review, Jul 2026 |
| HostGator | Global TTFB 1.23 s; uptime 99.68%; 762 ms at 500 users | Hostingstep HostGator review, 2026 |
| HostGator | Hardware joint-highest in the field after the Oracle move | Hostingstep, 1 Sep 2026 update |
| ChemiCloud | US TTFB 531 ms; global 460 ms | Hostingstep, Oct 2025 – May 2026 |
| ChemiCloud | Load 1,068 ms at a 4.2% error rate | Hostingstep, same window |
| ChemiCloud | Uptime 99.76%; overall 6.1 of 10, degrading | Hostingstep, tracked since 2021 |
| GoDaddy shared | TTFB 751 ms; load test did not complete | Hostingstep, Nov 2025 – Jun 2026 |
| GoDaddy shared | Uptime 99.76% | Hostingstep, Nov 2025 – Jun 2026 |
| GoDaddy Managed WordPress | TTFB 344 ms; hardware 3.8 of 10 | Hostingstep, 2026 |
| GreenGeeks | TTFB 395 ms North America, 447 ms Europe | Long-term independent testing, 2026 |
| GreenGeeks | TTFB 580–610 ms Asia and Australia | Same testing window |
| GreenGeeks | Load 26 ms at 0% errors; WPBench 5.0 of 10 | Hostingstep, 2026 |
| GreenGeeks | 25 outages in the window; no integrated CDN found | Hostingstep, 2026 |
| Kinsta | Origin TTFB 525 ms; edge figures differ | Hostingstep, 2026 |
| Kinsta | Load 40 ms at 0% errors; WPBench 8.8 of 10 | Hostingstep, 2026 reviews |
| DreamHost | TTFB 450–500 ms band | Hostingstep, 2026 benchmarks |
| Scala Hosting | Uptime 99.97% across twelve months | Live site, 40,000 monthly visitors, UptimeRobot |
| Scala Hosting | 29 ms at the 95th percentile, 50 users | k6 load test, 2026 |
| InterServer | Uptime 99.98% across eighteen months | Six production sites, UptimeRobot |
| InterServer | Load under 700 ms; under 1.5 s by another source | Two 2026 reviews |
| A2 Hosting | TTFB 150–198 ms | 2026 studies; LiteSpeed on Turbo tiers |
| IONOS | Global TTFB 480 ms; WPBench 7.2 of 10 | Hostingstep, 2026 benchmarks |
| IONOS | Uptime 99.99%; load test failed at 65.4% errors | Hostingstep, 2026 benchmarks |
| Namecheap | TTFB 461 ms; global 448 ms; WPBench 5.0 | Hostingstep, Q4 2025; monitoring paused 30 Jun 2026 |
| InMotion | TTFB 300–500 ms shared | Published measurement, 2026 |
| InMotion | Uptime 99.97–99.99%; one account near 99.5% | Several 2026 sources |
| Hostwinds | No independent measurement found | 99.9999% is the company's own claim |
| Liquid Web | Not covered by the benchmarks we cite | VPS and dedicated are outside their scope |
| SiteGround | TTFB 632 ms; 22nd of 34 hosts | Hostingstep, 2026 benchmarks |
| SiteGround | Uptime 99.96% in 2025; 193 min over 44 outages | Hostingstep, full year 2025 |
| SiteGround | WPBench 8.4 of 10; load 170 ms at 0% errors | Hostingstep, Oct 2025 – May 2026 |
| Scala Hosting | TTFB 465 ms; global 501 ms | Hostingstep, 2026 benchmarks |
| Scala Hosting | WPBench 8.8 of 10; load 48 ms at 0% errors | Hostingstep, 2026 benchmarks |
| Scala Hosting | Uptime 99.98% across the year | Hostingstep, 2026 benchmarks |
| Cloudways | Vultr HF: load 288 ms at 1.7% errors; WPBench 7.6 | Hostingstep Cloudways review, 2026 |
| Cloudways | Uptime 99.996% to 99.999% across five plans | Hostingstep, Oct 2025 – May 2026 |
| Bluehost VPS NVMe 2 | Stable performance, storage over 3,000 MiB/s, Feb 2026 trial | VPSBenchmarks |
| Contabo | Cloud VPS 10: price-weighted score 22; delivers advertised bandwidth | VPSBenchmarks trial, Dec 2025 |
| Contabo | Performance 60/100 | LearnWithHasan profile, 2026 |
| FatCow | Slow in a six-month speed test | WebsiteSetup review |
| HostPapa | Uptime 100% over six months; about 99.94% in a month-long test | LarryLudwig; WPHive 2026 |
When Traffic Spikes
However, the weak point is load: the test failed at 65.4% errors. In other words, IONOS stays up on a quiet day but struggles when traffic spikes.
Busy sites, moreover, can compare our high-traffic hosting picks to see who holds up under load. Costs appear in our IONOS pricing guide.
How IONOS Compares
For comparison, our tables list Hostinger at 99.99% and GoDaddy at 99.76%. Meanwhile, they list Bluehost, a Newfold Digital brand, at 99.99%. In short, every 0.01% equals almost an hour a year.
How to Monitor IONOS
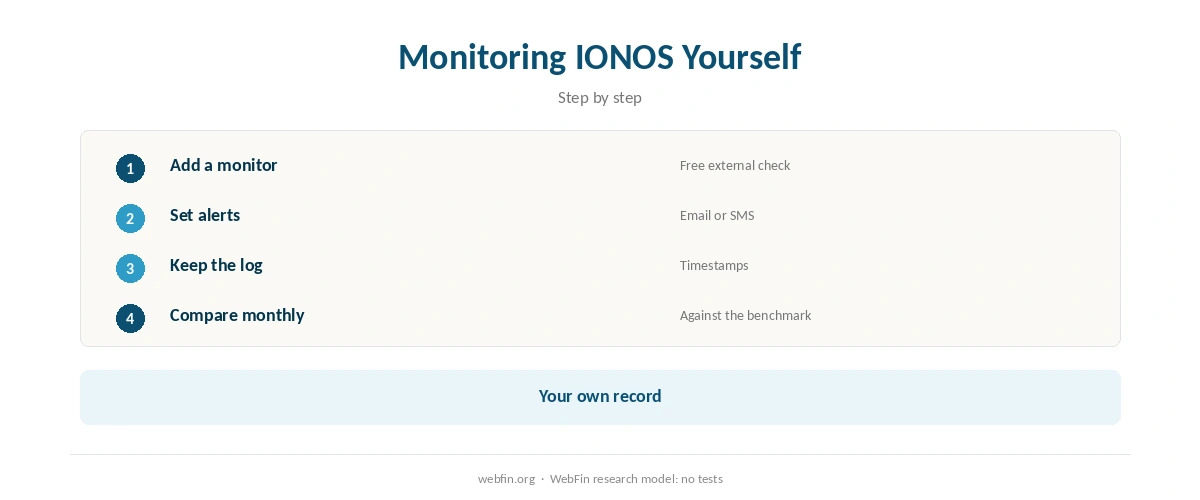
During an outage, our IONOS status guide lists where to check first. Setting up uptime monitoring, moreover, gives you timestamps for any claim.
Your own IONOS uptime record, in practice, matters more than averages. Our website speed test guide covers the speed side. Our guide to reading an uptime report helps you interpret them. To get help, our IONOS customer service guide covers how to report it.
Moreover, these guides cover related questions: IONOS renewal price and IONOS SSL.
How We Research
We run no tests. Uptime, speed and load figures come from our TablePress tables, built from Hostingstep’s benchmarks and other named sources, read in October 2026. Downtime in hours is our own arithmetic from the published percentages.
The criteria behind our scores are on our about page.
IONOS Uptime FAQ
In short, 99.99%, according to Hostingstep’s 2026 tests, or about 53 minutes of downtime a year.
Specifically, its 480 ms global TTFB and WPBench score of 7.2 of 10 are respectable for a budget host.
However, the weak point is load: the test failed at 65.4% errors.
Our IONOS status guide lists the status page and monitors.
Yes; therefore add a free external monitor, which checks every few minutes and records each outage.
The Verdict
Overall, IONOS uptime of 99.99% means about 53 minutes of downtime a year. In addition, the load results above complete the verdict.
To compare options, our IONOS alternatives list rivals.
In practice, weigh IONOS uptime alongside load results and your own monitoring.