
Disclosure: WebFin is reader-supported. If you buy hosting through links on this page, we may earn a commission at no extra cost to you. Commissions vary between providers and our ratings do not — here’s our full disclosure.
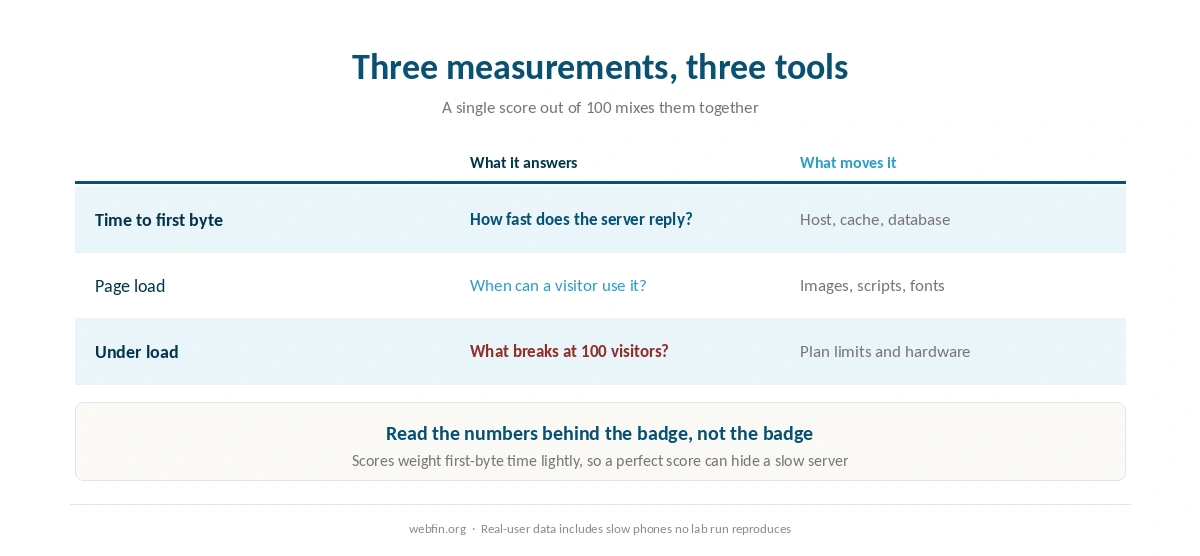
To test your site speed properly, decide first which of three things you are measuring. One is how long the server takes to answer. Another is how long the page takes to become usable. The third is how the site behaves when many people arrive at once. Then test the page your visitors actually use, from where they are, several times, and write the results down. Most speed tests fail on the second step: they measure a cached home page and tell you nothing about the checkout.
How to Test Your Site Speed Properly: The Short Answer
Run each test at least three times and take the median. Test an uncached page as well as the home page. Choose a location near your visitors. Compare a quiet hour with a busy one. For load testing, watch the error rate, not just the time, and check your host’s policy first.
Three Different Measurements
Time to first byte. How long the server takes to start answering. This is the hosting part, and it is what the benchmark projects we cite mostly report. Our guide to reducing TTFB covers what moves it.
Page load and usability. How long until a visitor can read and click. Images, scripts and fonts dominate this, and a fast server cannot rescue a heavy page.
Behavior under load. What happens when a hundred people arrive together. This is a different test with a different tool, and the interesting number is the error rate.
⚠️ A single score out of 100 mixes these together and hides which one is your problem. Read the individual numbers behind it rather than the badge.
| Host | Measurement | Source and date |
|---|---|---|
| WP Engine | Global TTFB 65 ms, 1st of 34 hosts | Hostingstep, 2025 ranking, 40 locations |
| WP Engine | US TTFB 365 ms across 22 locations | Hostingstep, 2025 ranking |
| WP Engine | TTFB 355 ms, 349,920 checks | Hostingstep, Oct 2025 – May 2026 |
| WP Engine | Uptime 99.976%, 10th of 14 managed hosts | Study of 14 managed hosts, 2026 |
| WP Engine | Load 27 ms at 0% errors | Hostingstep, 2026 benchmarks |
| Rocket.net | Cached TTFB 85 ms globally | 12-month test, Mar 2025 – Mar 2026 |
| Rocket.net | Origin TTFB 310 ms; checkout bypasses cache | Same 12-month test |
| Rocket.net | Uptime 99.97%, seven outages in the window | Hostingstep, Oct 2025 – May 2026 |
| Rocket.net | Hardware score fell 8.5 → 7.5; not recommended | Hostingstep, 2026, tracked since Oct 2020 |
| Hostinger Business | Global TTFB 223 ms, 5th of 34 hosts | Hostingstep, 2026 |
| Hostinger Premium | Global TTFB 495 ms, 28th of 34; no CDN | Hostingstep, 2026 |
| Hostinger | TTFB 707 ms; server response 246 ms | Cybernews, June 2026 |
| Hostinger | Uptime 99.99%, 33 min down in 2025 | Hostingstep, continuous since 2021 |
| Hostinger | Uptime 99.93%, 6-month window | HostPro Reviews, 2026 |
| Hostinger | LCP 0.607 s, 2nd of 15 hosts | TechRadar, 10-week window, 2026 |
| Bluehost | Hardware score 9.6 of 10 | Hostingstep, 2026 |
| Bluehost | Load 41 ms at 0% errors after the Oracle move | Hostingstep changelog, 9 Jul 2026 |
| Bluehost | Response 411 ms; uptime 99.99% across 9 outages | Hostingstep, Nov 2025 – Aug 2026 |
| Bluehost | Global TTFB 224 ms across 40 locations, cached | Hostingstep Bluehost review, Jul 2026 |
| HostGator | Global TTFB 1.23 s; uptime 99.68%; 762 ms at 500 users | Hostingstep HostGator review, 2026 |
| HostGator | Hardware joint-highest in the field after the Oracle move | Hostingstep, 1 Sep 2026 update |
| ChemiCloud | US TTFB 531 ms; global 460 ms | Hostingstep, Oct 2025 – May 2026 |
| ChemiCloud | Load 1,068 ms at a 4.2% error rate | Hostingstep, same window |
| ChemiCloud | Uptime 99.76%; overall 6.1 of 10, degrading | Hostingstep, tracked since 2021 |
| GoDaddy shared | TTFB 751 ms; load test did not complete | Hostingstep, Nov 2025 – Jun 2026 |
| GoDaddy shared | Uptime 99.76% | Hostingstep, Nov 2025 – Jun 2026 |
| GoDaddy Managed WordPress | TTFB 344 ms; hardware 3.8 of 10 | Hostingstep, 2026 |
| GreenGeeks | TTFB 395 ms North America, 447 ms Europe | Long-term independent testing, 2026 |
| GreenGeeks | TTFB 580–610 ms Asia and Australia | Same testing window |
| GreenGeeks | Load 26 ms at 0% errors; WPBench 5.0 of 10 | Hostingstep, 2026 |
| GreenGeeks | 25 outages in the window; no integrated CDN found | Hostingstep, 2026 |
| Kinsta | Origin TTFB 525 ms; edge figures differ | Hostingstep, 2026 |
| Kinsta | Load 40 ms at 0% errors; WPBench 8.8 of 10 | Hostingstep, 2026 reviews |
| DreamHost | TTFB 450–500 ms band | Hostingstep, 2026 benchmarks |
| Scala Hosting | Uptime 99.97% across twelve months | Live site, 40,000 monthly visitors, UptimeRobot |
| Scala Hosting | 29 ms at the 95th percentile, 50 users | k6 load test, 2026 |
| InterServer | Uptime 99.98% across eighteen months | Six production sites, UptimeRobot |
| InterServer | Load under 700 ms; under 1.5 s by another source | Two 2026 reviews |
| A2 Hosting | TTFB 150–198 ms | 2026 studies; LiteSpeed on Turbo tiers |
| IONOS | Global TTFB 480 ms; WPBench 7.2 of 10 | Hostingstep, 2026 benchmarks |
| IONOS | Uptime 99.99%; load test failed at 65.4% errors | Hostingstep, 2026 benchmarks |
| Namecheap | TTFB 461 ms; global 448 ms; WPBench 5.0 | Hostingstep, Q4 2025; monitoring paused 30 Jun 2026 |
| InMotion | TTFB 300–500 ms shared | Published measurement, 2026 |
| InMotion | Uptime 99.97–99.99%; one account near 99.5% | Several 2026 sources |
| Hostwinds | No independent measurement found | 99.9999% is the company's own claim |
| Liquid Web | Not covered by the benchmarks we cite | VPS and dedicated are outside their scope |
| SiteGround | TTFB 632 ms; 22nd of 34 hosts | Hostingstep, 2026 benchmarks |
| SiteGround | Uptime 99.96% in 2025; 193 min over 44 outages | Hostingstep, full year 2025 |
| SiteGround | WPBench 8.4 of 10; load 170 ms at 0% errors | Hostingstep, Oct 2025 – May 2026 |
| Scala Hosting | TTFB 465 ms; global 501 ms | Hostingstep, 2026 benchmarks |
| Scala Hosting | WPBench 8.8 of 10; load 48 ms at 0% errors | Hostingstep, 2026 benchmarks |
| Scala Hosting | Uptime 99.98% across the year | Hostingstep, 2026 benchmarks |
| Cloudways | Vultr HF: load 288 ms at 1.7% errors; WPBench 7.6 | Hostingstep Cloudways review, 2026 |
| Cloudways | Uptime 99.996% to 99.999% across five plans | Hostingstep, Oct 2025 – May 2026 |
Step 1: Test the Page Your Visitors Use
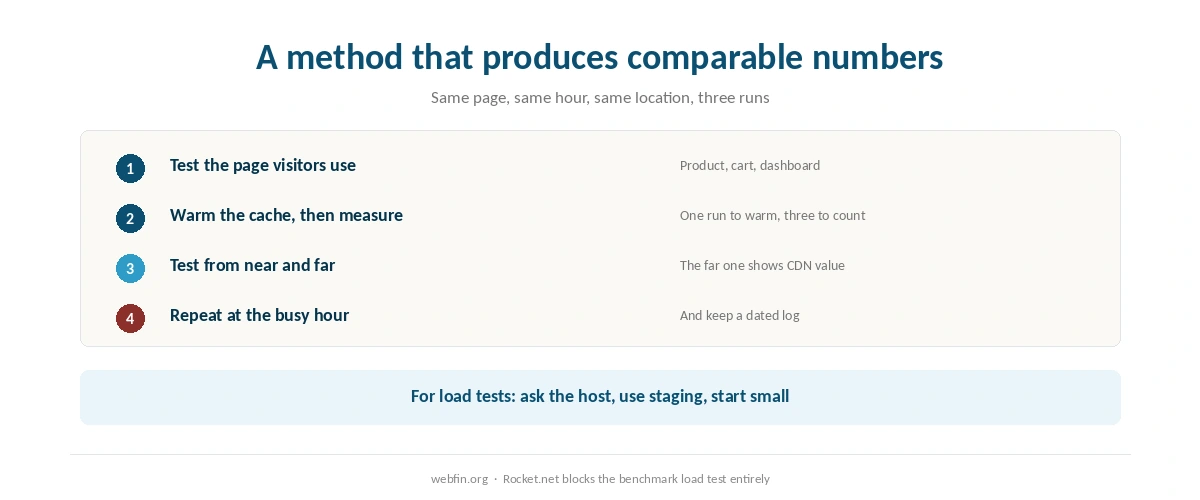
A cached home page is the easiest page your site will ever serve. If your visitors spend their time on a product page, a search result, a member dashboard or a checkout, test those. Those pages bypass the cache, reach the database, and are where a weak plan shows.
For a shop, test a category page and the cart. For a membership site, log in and test a dashboard. On many sites those pages differ from the home page by more than two hosts differ from each other. Our list of hosting for membership sites explains why.
Step 2: Warm the Cache, Then Measure
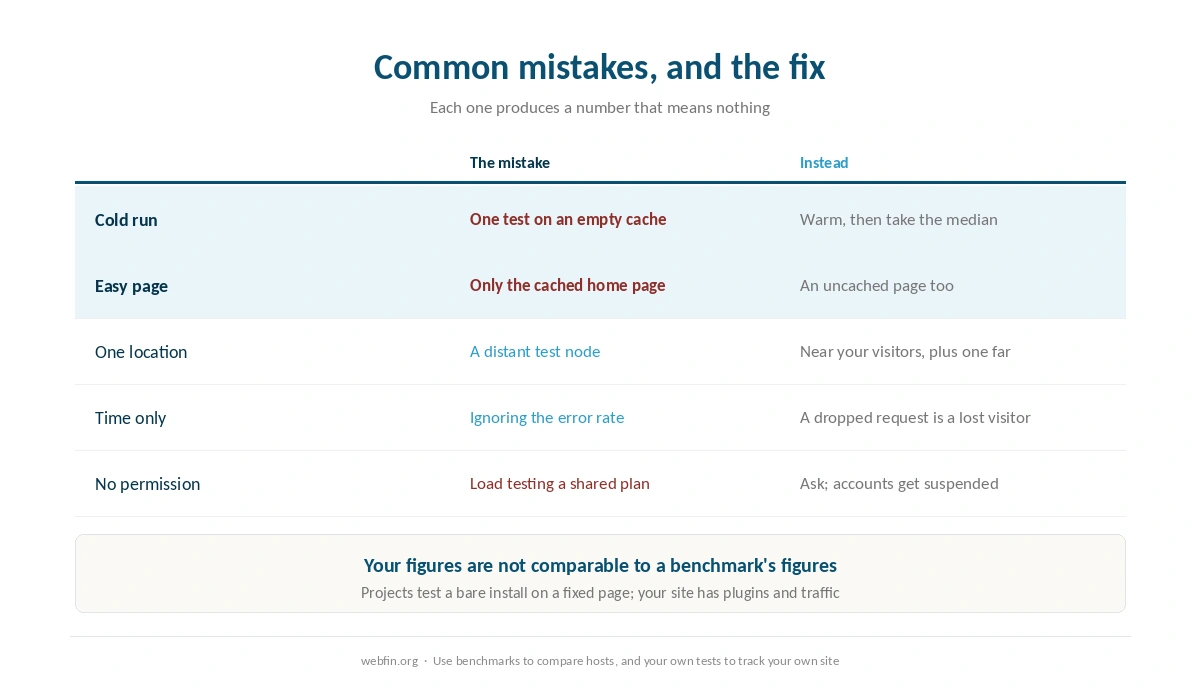
The first request after a change is the slowest, because the cache is empty. Run the test once to warm it, then three more times and take the median. One cold run reported as a result is the commonest way people conclude that a host is slow.
If you are comparing two hosts, do the same thing on both, at the same hour, on the same kind of page. Anything else compares the conditions rather than the hosts.
Step 3: Test From Where Your Visitors Are
A test node in Virginia tells a London audience very little, and a global average tells a single-country audience even less. Pick the location closest to most of your visitors, then add one far away to see what a distant reader experiences.
That second test is the one that shows whether you need a content network. A large gap between near and far, on a page that can be cached, is what an edge network fixes. Our guide to setting up a CDN describes the setup.
Step 4: Compare a Quiet Hour With a Busy One
Run the same test at a quiet hour and again at your busiest. If the busy-hour figure is much worse with no change to the site, your account is meeting its limits, or the server is crowded. That is a different problem from a heavy page, and it needs a different fix.
Keep the results in a file with dates and times. A log of slow readings at busy hours is what turns a support conversation into evidence, as our guide to checking whether your host is throttling you explains.
Step 5: Load Testing, and the Etiquette of It
A load test sends many simultaneous visitors and reports how many requests failed. That failure rate is the point. In the 2026 benchmarks we cite, the IONOS entry plan failed with a 65.4% error rate and ChemiCloud answered at 1,068 ms with 4.2% failing, while Scala Hosting and GreenGeeks completed the same test cleanly.
Before you run one, read your host’s policy. Load testing looks like an attack to a network, and some hosts require notice or block it outright: Rocket.net blocks the benchmark test entirely. Run it on a staging copy where you can, at a quiet hour, and start with a small number of users. Our guide to setting up a staging site covers the copy.
⚠️ Do not load test a shared plan without asking. The traffic is shared, the limits are shared, and the account can be suspended for resource abuse under the acceptable use policy. Our piece on what unlimited hosting means covers those terms.
Step 6: Separate Lab Numbers From Real Visitors
A test tool simulates one visit on one connection. Real-user measurements come from the browsers of people who actually visited, and they include slow phones and bad networks that no lab run reproduces.
Use both, and expect them to disagree. When the lab result is good and real visitors are slow, look first at the range of devices and connections rather than at the server. When both are slow on an uncached page, look at the host.
Testing a Host Before You Move
The most useful test you can run is on a host you do not own yet. Install a copy of your site on a trial or a monthly plan, point a test subdomain at it, and run the same measurements you ran on your current host. Hosts that bill by the hour, such as Cloudways, make that cheap; hosts with long refund windows, such as InMotion at 90 days, make it low-risk.
Test the uncached page, the busy hour and a far location, as before. Then decide with your own numbers rather than a plan page. Our page on hosting renewal prices covers the other half of that decision, which no test can tell you.
What Not to Conclude
A perfect score does not mean a fast site. Scores weight some things heavily and ignore first-byte time almost entirely.
One test does not show a trend. Hosts vary hour to hour, and a single reading is a snapshot of the network as much as the server.
Your figure is not comparable to a benchmark figure. Projects test a bare install on a fixed page from fixed locations. Your site has plugins, images and traffic.
A slow admin area is not always the host. It is never cached, so it shows plugin weight first. Our roundup of hosting for high traffic ranks hosts by the load test rather than by a score.
A Testing Routine Worth Keeping
Once a month, test the home page and one uncached page, from a near location and a far one, three runs each, and record the medians with the date. Twelve rows a year turn arguments about speed into a picture of it.
Test again after every change that could matter: a new plugin, a theme update, a caching change, a move to a new host. The value of a routine is that it tells you which change mattered. Our guide to migrating web hosting suggests the same measurements before and after a move.
How We Research
We run no tests ourselves. The load, response and uptime figures named here come from Hostingstep’s 2026 benchmarks and reviews, each with its window. This guide describes how to read and reproduce that kind of measurement rather than endorsing a particular tool.
Host policies on load testing come from the providers’ own terms, read on 20 September 2026. The criteria behind our scores are on our about page, and our guide to reading an uptime report covers the other half of hosting evidence.
Site Speed Testing FAQ
Run one to warm the cache, then three more and take the median. A single cold run measures an empty cache and the network at that moment rather than your site.
The page your visitors use. A cached home page is the easiest page your site serves. Test a product page, a search result, a cart or a logged-in dashboard, because those bypass the cache and reach the database.
No. Scores mix several measurements and weight first-byte time lightly. Read the individual numbers: server response, page load and, separately, the error rate under load.
Ask first. Load testing resembles an attack, and accounts can be suspended for resource abuse under an acceptable use policy. Some hosts block it outright: Rocket.net blocks the benchmark test we cite.
Projects test a bare install on a fixed page from fixed locations, while your site has plugins, images and real traffic. Use benchmarks to compare hosts with each other, and your own tests to track your own site.
The Verdict
Testing properly is mostly about honesty of method. Decide which measurement you want, test the page that matters rather than the easy one, warm the cache, use a location near your audience, and repeat at a busy hour. Then write it down.
For load testing, ask your host first, run it on staging, and read the error rate rather than the average time. A plan that answers in a second but drops one request in twenty-four is worse than a slower plan that drops none. Our list of hosting for ecommerce covers the sites that feel that difference first.