
Disclosure: WebFin is reader-supported. If you buy hosting through links on this page, we may earn a commission at no extra cost to you. Commissions vary between providers and our ratings do not — here’s our full disclosure.
The best hosting for high traffic is chosen on a load test, not on a response time. A server that answers one visitor in 300 ms can still drop requests when a hundred arrive together, and that is the failure a busy site actually meets. So this guide ranks hosts by how they handled concurrent visitors in published testing, then by how each one bills you as traffic grows. Those two things decide the choice, and neither appears on a pricing page. For sites where every page bypasses the cache, see hosting for membership sites.
Best Hosting for High Traffic: The Short Answer
WP Engine, for a WordPress site with traffic and a budget. It served the load test in 27 ms with no errors and answers globally in 65 ms. Scala Hosting is the cheapest way to add real capacity, at $36.00 a year per processor core. Kinsta suits sites that need each property isolated. Running the same kind of test yourself is covered in testing your site speed properly.
What High Traffic Actually Tests
Traffic is a question of concurrency. The benchmark project we cite ramps to 100 concurrent visitors over 60 seconds and records the average response and the share of requests that failed. A host that stays fast and error-free through that is one you can put a newsletter launch or a sale in front of. What to do on the day is covered in how to handle a traffic spike.
Two other things matter. Cached pages are cheap to serve, so a content site behind an edge network handles far more than a store, where carts and checkouts bypass the cache. And a single spike is different from sustained load: a shared plan can survive a viral post and still be the wrong home for a site that is busy every day.
⚠️ Response time on its own is the wrong number here. It measures one visitor at a time. Our guide to reducing TTFB covers that number, and this guide is about the one that comes after it.
| Host | Measurement | Source and date |
|---|---|---|
| WP Engine | Global TTFB 65 ms, 1st of 34 hosts | Hostingstep, 2025 ranking, 40 locations |
| WP Engine | US TTFB 365 ms across 22 locations | Hostingstep, 2025 ranking |
| WP Engine | TTFB 355 ms, 349,920 checks | Hostingstep, Oct 2025 – May 2026 |
| WP Engine | Uptime 99.976%, 10th of 14 managed hosts | Study of 14 managed hosts, 2026 |
| WP Engine | Load 27 ms at 0% errors | Hostingstep, 2026 benchmarks |
| Rocket.net | Cached TTFB 85 ms globally | 12-month test, Mar 2025 – Mar 2026 |
| Rocket.net | Origin TTFB 310 ms; checkout bypasses cache | Same 12-month test |
| Rocket.net | Uptime 99.97%, seven outages in the window | Hostingstep, Oct 2025 – May 2026 |
| Rocket.net | Hardware score fell 8.5 → 7.5; not recommended | Hostingstep, 2026, tracked since Oct 2020 |
| Hostinger Business | Global TTFB 223 ms, 5th of 34 hosts | Hostingstep, 2026 |
| Hostinger Premium | Global TTFB 495 ms, 28th of 34; no CDN | Hostingstep, 2026 |
| Hostinger | TTFB 707 ms; server response 246 ms | Cybernews, June 2026 |
| Hostinger | Uptime 99.99%, 33 min down in 2025 | Hostingstep, continuous since 2021 |
| Hostinger | Uptime 99.93%, 6-month window | HostPro Reviews, 2026 |
| Hostinger | LCP 0.607 s, 2nd of 15 hosts | TechRadar, 10-week window, 2026 |
| Bluehost | Hardware score 9.6 of 10 | Hostingstep, 2026 |
| Bluehost | Load 41 ms at 0% errors after the Oracle move | Hostingstep changelog, 9 Jul 2026 |
| Bluehost | Response 411 ms; uptime 99.99% across 9 outages | Hostingstep, Nov 2025 – Aug 2026 |
| Bluehost | Global TTFB 224 ms across 40 locations, cached | Hostingstep Bluehost review, Jul 2026 |
| HostGator | Global TTFB 1.23 s; uptime 99.68%; 762 ms at 500 users | Hostingstep HostGator review, 2026 |
| HostGator | Hardware joint-highest in the field after the Oracle move | Hostingstep, 1 Sep 2026 update |
| ChemiCloud | US TTFB 531 ms; global 460 ms | Hostingstep, Oct 2025 – May 2026 |
| ChemiCloud | Load 1,068 ms at a 4.2% error rate | Hostingstep, same window |
| ChemiCloud | Uptime 99.76%; overall 6.1 of 10, degrading | Hostingstep, tracked since 2021 |
| GoDaddy shared | TTFB 751 ms; load test did not complete | Hostingstep, Nov 2025 – Jun 2026 |
| GoDaddy shared | Uptime 99.76% | Hostingstep, Nov 2025 – Jun 2026 |
| GoDaddy Managed WordPress | TTFB 344 ms; hardware 3.8 of 10 | Hostingstep, 2026 |
| GreenGeeks | TTFB 395 ms North America, 447 ms Europe | Long-term independent testing, 2026 |
| GreenGeeks | TTFB 580–610 ms Asia and Australia | Same testing window |
| GreenGeeks | Load 26 ms at 0% errors; WPBench 5.0 of 10 | Hostingstep, 2026 |
| GreenGeeks | 25 outages in the window; no integrated CDN found | Hostingstep, 2026 |
| Kinsta | Origin TTFB 525 ms; edge figures differ | Hostingstep, 2026 |
| Kinsta | Load 40 ms at 0% errors; WPBench 8.8 of 10 | Hostingstep, 2026 reviews |
| DreamHost | TTFB 450–500 ms band | Hostingstep, 2026 benchmarks |
| Scala Hosting | Uptime 99.97% across twelve months | Live site, 40,000 monthly visitors, UptimeRobot |
| Scala Hosting | 29 ms at the 95th percentile, 50 users | k6 load test, 2026 |
| InterServer | Uptime 99.98% across eighteen months | Six production sites, UptimeRobot |
| InterServer | Load under 700 ms; under 1.5 s by another source | Two 2026 reviews |
| A2 Hosting | TTFB 150–198 ms | 2026 studies; LiteSpeed on Turbo tiers |
| IONOS | Global TTFB 480 ms; WPBench 7.2 of 10 | Hostingstep, 2026 benchmarks |
| IONOS | Uptime 99.99%; load test failed at 65.4% errors | Hostingstep, 2026 benchmarks |
| Namecheap | TTFB 461 ms; global 448 ms; WPBench 5.0 | Hostingstep, Q4 2025; monitoring paused 30 Jun 2026 |
| InMotion | TTFB 300–500 ms shared | Published measurement, 2026 |
| InMotion | Uptime 99.97–99.99%; one account near 99.5% | Several 2026 sources |
| Hostwinds | No independent measurement found | 99.9999% is the company's own claim |
| Liquid Web | Not covered by the benchmarks we cite | VPS and dedicated are outside their scope |
| SiteGround | TTFB 632 ms; 22nd of 34 hosts | Hostingstep, 2026 benchmarks |
| SiteGround | Uptime 99.96% in 2025; 193 min over 44 outages | Hostingstep, full year 2025 |
| SiteGround | WPBench 8.4 of 10; load 170 ms at 0% errors | Hostingstep, Oct 2025 – May 2026 |
| Scala Hosting | TTFB 465 ms; global 501 ms | Hostingstep, 2026 benchmarks |
| Scala Hosting | WPBench 8.8 of 10; load 48 ms at 0% errors | Hostingstep, 2026 benchmarks |
| Scala Hosting | Uptime 99.98% across the year | Hostingstep, 2026 benchmarks |
| Cloudways | Vultr HF: load 288 ms at 1.7% errors; WPBench 7.6 | Hostingstep Cloudways review, 2026 |
| Cloudways | Uptime 99.996% to 99.999% across five plans | Hostingstep, Oct 2025 – May 2026 |
Three Ways to Pay for Growth
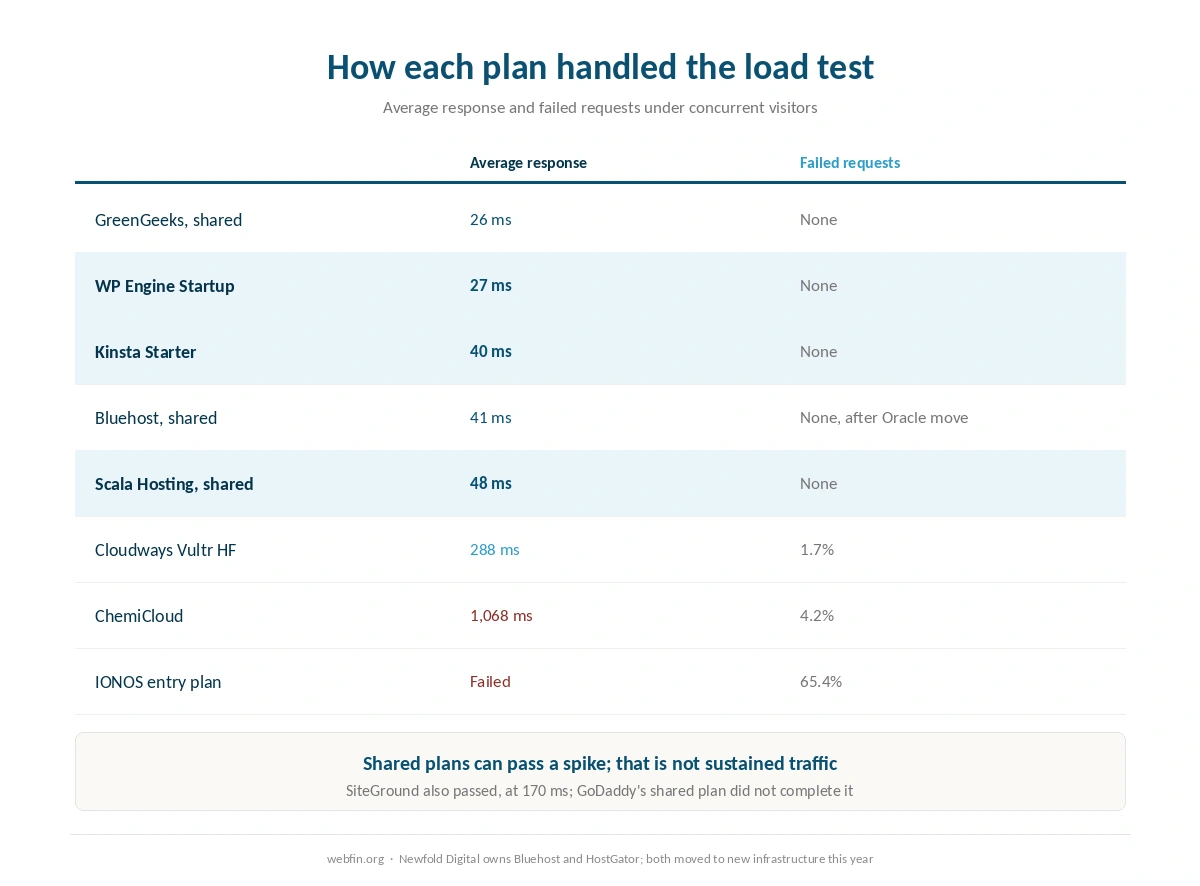
By visits. WP Engine and Kinsta sell plans with a stated monthly visit allowance. Startup at WP Engine includes 25,000, and its tiers run to 400,000. The bill rises in steps as traffic crosses them, which is predictable and expensive.
By resources. Scala Hosting prices its VPS per processor core and per gigabyte of memory, and Cloudways sells servers you resize. The bill tracks capacity rather than visitors, so a well-cached site pays far less per visit.
By dedicated server. Liquid Web sells managed servers from $33.00 a month on annual billing, with resources that belong to one customer. The bill is flat and the capacity is yours, whether or not the traffic arrives.
WP Engine: The Strongest Published Record
WP Engine served the load test in 27 ms with no errors and answers in 355 ms from the United States. Its edge network answers in 65 ms across 40 locations, first of 34 hosts in the benchmark project’s 2025 ranking.
Strengths. The best combination of load handling and global delivery we can cite. Tiers from 25,000 to 400,000 visits, so the path up is published. Three environments per site for testing changes before a busy day.
Weaknesses. Price, at $35.00 a month on renewal for 25,000 visits. No phone line on Startup. Visits past the tier trigger overage handling, which is a cost you should read before a launch. Our page on negotiating a renewal discount covers the ten-minute conversation worth having.
Choose it if the site earns from its traffic. Skip it if most of the traffic is uncached and the budget is tight. Our WP Engine review prices the higher tiers.
Kinsta: Isolation per Site
Kinsta served the same kind of test in 40 ms with every request answered, and scores 8.8 of 10 on server hardware. Starter is $35.00 a month flat, with 25,000 visits and no promotional term to expire.
Strengths. Each site runs in its own container, so a spike on one property cannot slow another. Strong hardware for uncached work. A flat price that is easy to budget.
Weaknesses. Its origin response of 525 ms is slower than its load result suggests, so caching carries the fast figures. There is no telephone line at any tier.
Choose it if several busy sites must not affect each other. Skip it if you need phone support. Our Kinsta review has the full scoring.
Scala Hosting: Capacity by the Unit
Scala’s shared plan served the load test in 48 ms with no errors and scores 8.8 of 10 on hardware. The product that matters for traffic is its VPS, where a processor core costs $36.00 a year and a gigabyte of memory $12.00, and both can be added for a busy month and removed after.
Strengths. The cheapest way to buy capacity rather than visits. Resources that change without a plan migration. No per-account panel license, because it runs its own SPanel.
Weaknesses. No phone line. You decide the sizing, so a site that grows faster than you watch it will slow before you notice. Ownership is not documented in anything we read.
Choose it if traffic is seasonal or growing in steps. Skip it if you want someone else to size the server. Our guide to moving from shared to VPS covers the move itself.
Liquid Web: A Server That Is Only Yours
Liquid Web sells managed servers with dedicated resources at every tier, from $33.00 a month on annual billing. It commits in writing to answering phone and chat within 59 seconds and to 100% network uptime, backed by service credits.
Strengths. No neighbors, so no one else’s traffic reaches yours. A support commitment with a number in it. Monthly billing on managed plans, with no contract.
Weaknesses. The benchmark project we cite does not cover VPS or dedicated servers, so there is no load figure to compare. Recent reviews cite customer accounts of longer waits than the 59-second promise.
Choose it if the site needs guaranteed resources and a support contract. Skip it if you want measured evidence before paying. Our Liquid Web review covers the range.
Cloudways: Flexible, With a Weaker Load Result
Cloudways sells servers from $14.00 a month with no promotional term and bills as you go. Uptime held between 99.996% and 99.999% across five plans in the benchmark window, which is excellent.
Strengths. Resize the server in minutes. Choose the underlying cloud. Stop paying the moment you stop the server.
Weaknesses. Under load it is the weakest pick here: the Vultr High Frequency plan served the test at 288 ms with a 1.7% error rate. For a site whose traffic arrives in waves, that is the number to read before choosing it.
Choose it if you manage capacity yourself and value flexibility. Skip it if spikes are the whole problem. Our Cloudways review covers each cloud.
Shared Plans That Survive a Spike, and Some That Did Not
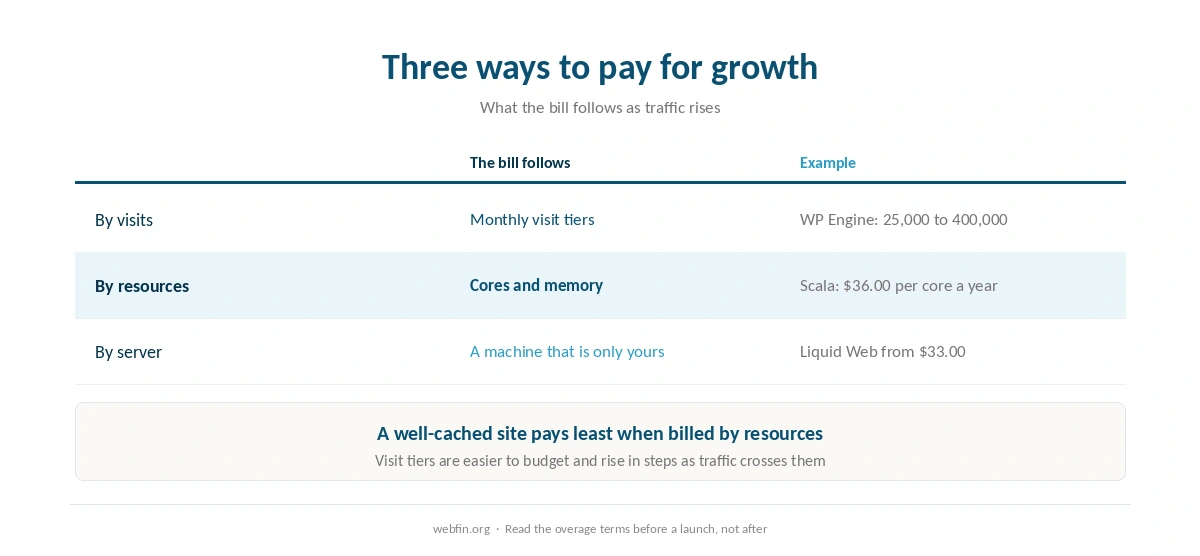
Several shared plans handled the load test cleanly: GreenGeeks at 26 ms, Bluehost at 41 ms after its move to Oracle Cloud, Scala at 48 ms and SiteGround at 170 ms, all without errors. For a blog that goes viral twice a year, that is enough, as our guide to hosting for bloggers explains. For a site that is busy every day, a shared plan is still the wrong home.
Several did not. The IONOS entry plan failed the test with a 65.4% error rate. ChemiCloud answered at 1,068 ms with 4.2% of requests failing. GoDaddy’s shared plan did not complete it. HostGator, in an older run before its move to new data centers, answered at 762 ms under 500 concurrent visitors. HostGator and Bluehost both belong to Newfold Digital, which moved both onto new infrastructure this year. Those are the results to remember when a pricing page promises that a plan scales.
Four Situations, Four Answers
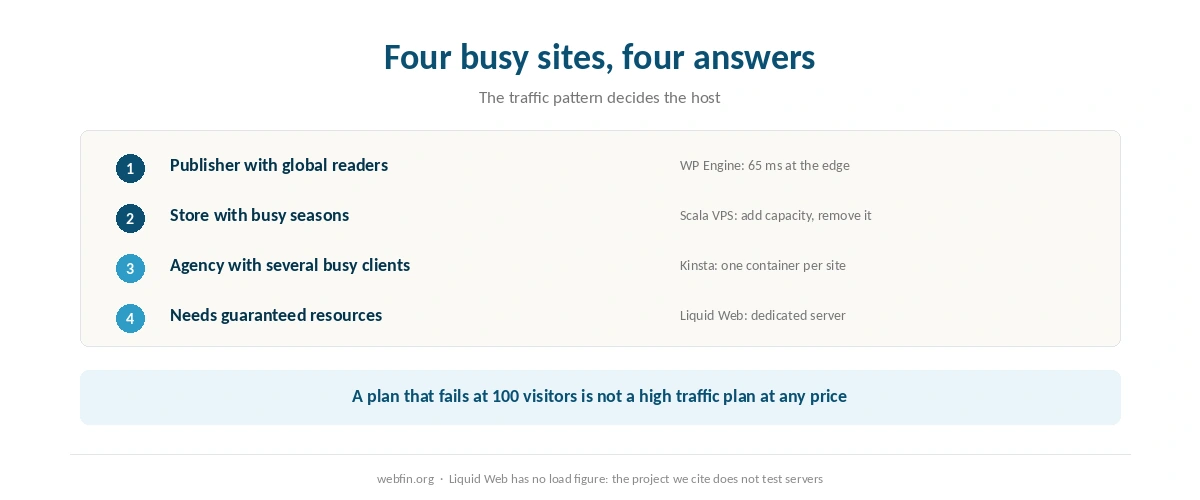
A publisher with global readers. WP Engine, because its edge network serves cached pages near the reader and its load result is the strongest we cite.
A store with busy seasons. Scala Hosting VPS, adding capacity for the season and removing it after. Our list of WooCommerce hosting covers the store side in more depth.
An agency with several busy clients. Kinsta, so one client’s launch never slows another’s site.
A business that needs guaranteed resources. Liquid Web, accepting that the evidence is a contract rather than a benchmark.
How We Research
We run no load tests of our own. Load, response and uptime figures come from Hostingstep’s 2026 benchmarks and reviews, which ramp to 100 concurrent visitors over 60 seconds, and each figure carries its window. Liquid Web has no figure because that project does not cover servers, and we say so rather than substituting one.
Prices come from the providers’ own pages, read on 20 September 2026. The criteria behind our scores are on our about page, and our guide to reading an uptime report explains how to judge the figures in the table above.
High Traffic Hosting FAQ
How the host handles concurrent visitors. A load test that ramps to 100 visitors and records errors tells you more than any response time, because response time measures one visitor at a time. Caching and an edge network matter next.
It can handle a spike. GreenGeeks, Bluehost, Scala and SiteGround all passed the load test on shared plans with no errors. Sustained daily traffic is different, because shared plans cap resources in their terms, and a busy site eventually meets those limits.
In the 2026 benchmarks the IONOS entry plan failed with a 65.4% error rate, ChemiCloud answered at 1,068 ms with 4.2% of requests failing, and GoDaddy’s shared plan did not complete the test. Those plans are not built for concurrency.
Per resource, for a well-cached site. Scala charges $36.00 a year per core and $12.00 per gigabyte, whatever the visit count. Per-visit plans such as WP Engine are simpler to budget and rise in steps as traffic crosses each tier.
Because the benchmark project we cite does not test servers, only shared and managed WordPress plans. Liquid Web offers dedicated resources and a written support commitment instead. We include it and state plainly that the evidence is a contract rather than a measurement.
The Verdict
WP Engine is the pick for a busy WordPress site that can pay for it, on the strongest load result and global delivery we can cite. Scala Hosting is the pick for anyone who would rather buy capacity than visits. Kinsta is the pick when several busy sites must stay isolated from each other.
Whatever you choose, read the load test before the response time and the overage terms before the headline price. A plan that fails at 100 visitors is not a high traffic plan at any price. If you are moving an existing site, our comparison of Bluehost against WP Engine shows what the step from shared to managed changes.