
Disclosure: WebFin is reader-supported. If you buy hosting through links on this page, we may earn a commission at no extra cost to you. Commissions vary between providers and our ratings do not — here’s our full disclosure.
We do not rank monitoring tools, because we price hosting rather than software. What we can offer is better than a ranking: two rows in our own tables exist only because somebody pointed a monitor at a live site. Scala Hosting records 99.97% across twelve months from a site with 40,000 monthly visitors, and InterServer 99.98% across eighteen months from six production sites, both measured with UptimeRobot.
Uptime Monitoring: The Short Answer
Run your own monitor, because a host dashboard is not evidence and a vendor claim is not a measurement. A free tier checking every five minutes from several locations covers an ordinary site. Watch a page that touches the database rather than the homepage, watch the certificate, and record outage counts rather than only percentages.
Why a Vendor Claim Is Not a Measurement
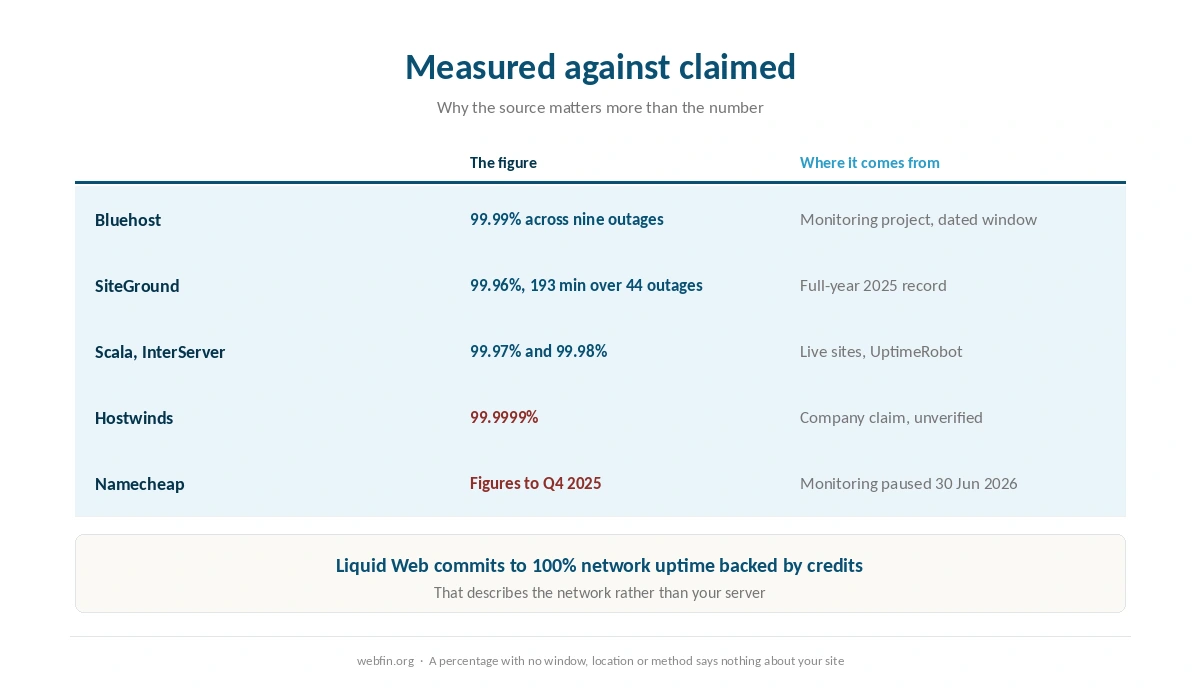
Hostwinds publishes 99.9999%. Our tables record that figure as the company’s own claim, and note that no independent measurement was found. That is not an accusation; it is the difference between a number and a number somebody checked.
Liquid Web commits to 100% network uptime. Backed by credits, which is a real commitment. It describes the network rather than your server, and that distinction matters on the morning your site is down, as our guide to reading a hosting agreement covers.
Monitoring can stop. Our Namecheap row carries a note that monitoring was paused on 30 June 2026, which is exactly why a figure without a window is not usable.
⚠️ The general rule: a percentage with no window, no location and no method behind it tells you nothing about your own site.
| Host | Measurement | Source and date |
|---|---|---|
| WP Engine | Global TTFB 65 ms, 1st of 34 hosts | Hostingstep, 2025 ranking, 40 locations |
| WP Engine | US TTFB 365 ms across 22 locations | Hostingstep, 2025 ranking |
| WP Engine | TTFB 355 ms, 349,920 checks | Hostingstep, Oct 2025 – May 2026 |
| WP Engine | Uptime 99.976%, 10th of 14 managed hosts | Study of 14 managed hosts, 2026 |
| WP Engine | Load 27 ms at 0% errors | Hostingstep, 2026 benchmarks |
| Rocket.net | Cached TTFB 85 ms globally | 12-month test, Mar 2025 – Mar 2026 |
| Rocket.net | Origin TTFB 310 ms; checkout bypasses cache | Same 12-month test |
| Rocket.net | Uptime 99.97%, seven outages in the window | Hostingstep, Oct 2025 – May 2026 |
| Rocket.net | Hardware score fell 8.5 → 7.5; not recommended | Hostingstep, 2026, tracked since Oct 2020 |
| Hostinger Business | Global TTFB 223 ms, 5th of 34 hosts | Hostingstep, 2026 |
| Hostinger Premium | Global TTFB 495 ms, 28th of 34; no CDN | Hostingstep, 2026 |
| Hostinger | TTFB 707 ms; server response 246 ms | Cybernews, June 2026 |
| Hostinger | Uptime 99.99%, 33 min down in 2025 | Hostingstep, continuous since 2021 |
| Hostinger | Uptime 99.93%, 6-month window | HostPro Reviews, 2026 |
| Hostinger | LCP 0.607 s, 2nd of 15 hosts | TechRadar, 10-week window, 2026 |
| Bluehost | Hardware score 9.6 of 10 | Hostingstep, 2026 |
| Bluehost | Load 41 ms at 0% errors after the Oracle move | Hostingstep changelog, 9 Jul 2026 |
| Bluehost | Response 411 ms; uptime 99.99% across 9 outages | Hostingstep, Nov 2025 – Aug 2026 |
| Bluehost | Global TTFB 224 ms across 40 locations, cached | Hostingstep Bluehost review, Jul 2026 |
| HostGator | Global TTFB 1.23 s; uptime 99.68%; 762 ms at 500 users | Hostingstep HostGator review, 2026 |
| HostGator | Hardware joint-highest in the field after the Oracle move | Hostingstep, 1 Sep 2026 update |
| ChemiCloud | US TTFB 531 ms; global 460 ms | Hostingstep, Oct 2025 – May 2026 |
| ChemiCloud | Load 1,068 ms at a 4.2% error rate | Hostingstep, same window |
| ChemiCloud | Uptime 99.76%; overall 6.1 of 10, degrading | Hostingstep, tracked since 2021 |
| GoDaddy shared | TTFB 751 ms; load test did not complete | Hostingstep, Nov 2025 – Jun 2026 |
| GoDaddy shared | Uptime 99.76% | Hostingstep, Nov 2025 – Jun 2026 |
| GoDaddy Managed WordPress | TTFB 344 ms; hardware 3.8 of 10 | Hostingstep, 2026 |
| GreenGeeks | TTFB 395 ms North America, 447 ms Europe | Long-term independent testing, 2026 |
| GreenGeeks | TTFB 580–610 ms Asia and Australia | Same testing window |
| GreenGeeks | Load 26 ms at 0% errors; WPBench 5.0 of 10 | Hostingstep, 2026 |
| GreenGeeks | 25 outages in the window; no integrated CDN found | Hostingstep, 2026 |
| Kinsta | Origin TTFB 525 ms; edge figures differ | Hostingstep, 2026 |
| Kinsta | Load 40 ms at 0% errors; WPBench 8.8 of 10 | Hostingstep, 2026 reviews |
| DreamHost | TTFB 450–500 ms band | Hostingstep, 2026 benchmarks |
| Scala Hosting | Uptime 99.97% across twelve months | Live site, 40,000 monthly visitors, UptimeRobot |
| Scala Hosting | 29 ms at the 95th percentile, 50 users | k6 load test, 2026 |
| InterServer | Uptime 99.98% across eighteen months | Six production sites, UptimeRobot |
| InterServer | Load under 700 ms; under 1.5 s by another source | Two 2026 reviews |
| A2 Hosting | TTFB 150–198 ms | 2026 studies; LiteSpeed on Turbo tiers |
| IONOS | Global TTFB 480 ms; WPBench 7.2 of 10 | Hostingstep, 2026 benchmarks |
| IONOS | Uptime 99.99%; load test failed at 65.4% errors | Hostingstep, 2026 benchmarks |
| Namecheap | TTFB 461 ms; global 448 ms; WPBench 5.0 | Hostingstep, Q4 2025; monitoring paused 30 Jun 2026 |
| InMotion | TTFB 300–500 ms shared | Published measurement, 2026 |
| InMotion | Uptime 99.97–99.99%; one account near 99.5% | Several 2026 sources |
| Hostwinds | No independent measurement found | 99.9999% is the company's own claim |
| Liquid Web | Not covered by the benchmarks we cite | VPS and dedicated are outside their scope |
| SiteGround | TTFB 632 ms; 22nd of 34 hosts | Hostingstep, 2026 benchmarks |
| SiteGround | Uptime 99.96% in 2025; 193 min over 44 outages | Hostingstep, full year 2025 |
| SiteGround | WPBench 8.4 of 10; load 170 ms at 0% errors | Hostingstep, Oct 2025 – May 2026 |
| Scala Hosting | TTFB 465 ms; global 501 ms | Hostingstep, 2026 benchmarks |
| Scala Hosting | WPBench 8.8 of 10; load 48 ms at 0% errors | Hostingstep, 2026 benchmarks |
| Scala Hosting | Uptime 99.98% across the year | Hostingstep, 2026 benchmarks |
| Cloudways | Vultr HF: load 288 ms at 1.7% errors; WPBench 7.6 | Hostingstep Cloudways review, 2026 |
| Cloudways | Uptime 99.996% to 99.999% across five plans | Hostingstep, Oct 2025 – May 2026 |
Two Numbers, Not One
SiteGround recorded 99.96% across 2025, with 193 minutes of downtime spread over 44 outages. Bluehost recorded 99.99% across nine outages in its window. The percentages are close and the experience is not.
Forty-four interruptions means a handful land while someone is checking out or mid-edit. Nine means most weeks pass without one. Any tool you choose should report both, which our guide to reading an uptime report covers in more detail.
What to Look for in a Tool
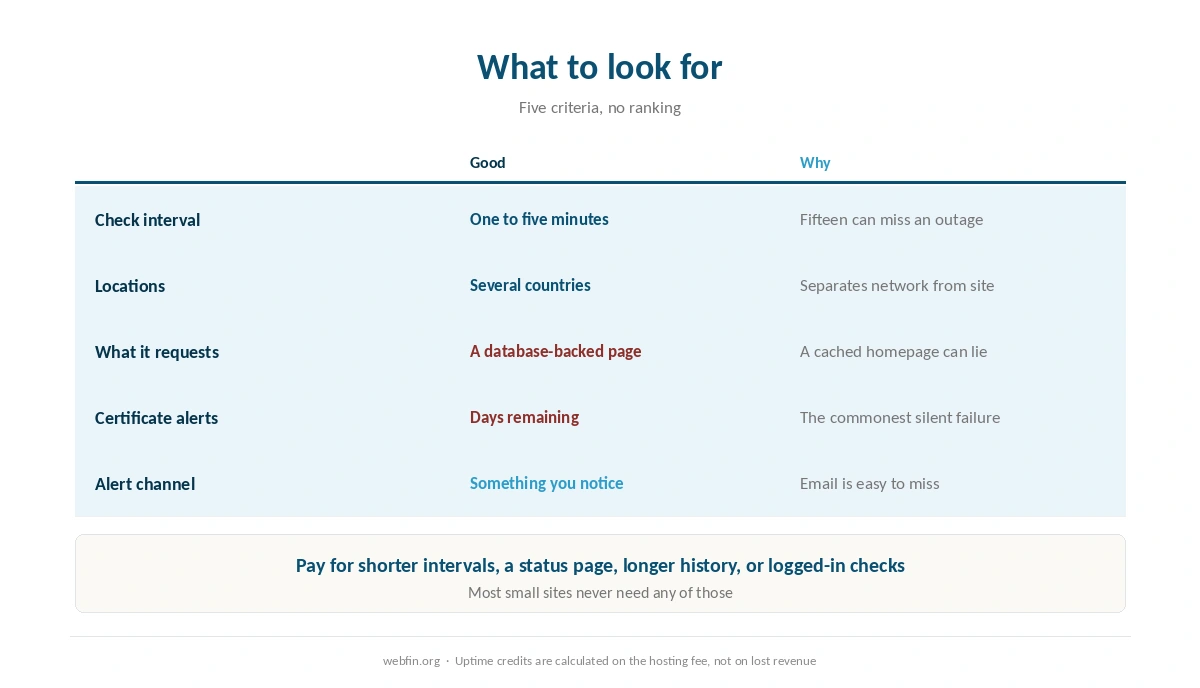
Check interval. One minute is ideal, five is workable, and a fifteen-minute interval can miss an outage entirely.
Several locations. A single probe in one country cannot distinguish a network problem from a site problem.
What it actually requests. A monitor that fetches only the homepage will happily report success while a cached page is served and the database is broken.
Certificate expiry alerts. A certificate that stopped renewing fails silently until visitors meet a browser warning, which our page on SSL certificates explains.
Alert channels you will notice. Email is easy to miss; a phone notification is not.
History you can keep. A year of records is what turns an argument with support into a conversation, and free tiers often keep less. Our guide to canceling hosting and getting a refund covers what to record.
And our list of hosting for small business covers who to ask when the record looks bad.
What to Monitor Besides the Homepage
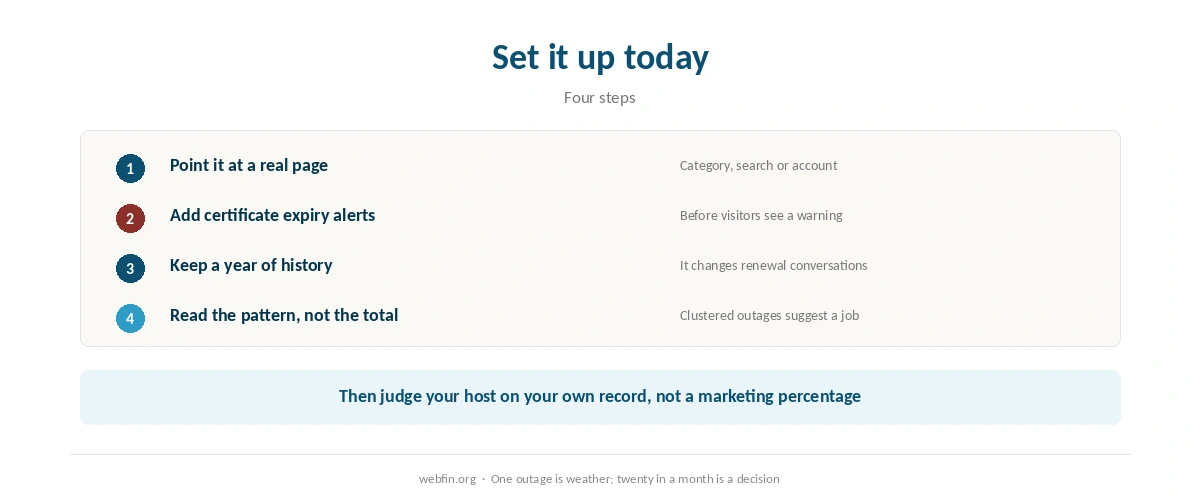
A page that queries the database. A category page, a search result, an account page: something a cache cannot fake.
The checkout or the login. For a store this is the only check that matters, and our list of hosting for ecommerce covers why those pages behave differently.
The certificate. Days remaining, checked automatically.
A page behind login, if you can. Member areas fail silently more often than public pages, because nobody visits them casually.
Free Tiers, and When to Pay
For a blog, a brochure site or a small business site, a free tier with five-minute checks and email alerts does the job. Plenty of sites never need more.
Pay when you need shorter intervals, more locations, a public status page for customers, longer history for a supplier conversation, or checks that log in and click something. That last category is where the real money is, and most site owners do not need it.
What to Do With the Data
Keep a year of it. A conversation about a renewal or a refund goes differently when you have your own record, which our guide to negotiating a renewal discount covers.
Note the pattern, not just the total. Outages clustered at the same hour suggest a scheduled job rather than bad luck.
Compare against the plan, not the brand. Resource faults at peak look like downtime and are often a limit instead, which our guide to checking whether your host is throttling you covers.
Act on repeats. One outage is weather. Twenty in a month is a decision, and our guide to migrating web hosting covers making it calmly.
A Note on Percentages and Money
Uptime guarantees are normally paid in credits rather than cash, and the credit is calculated on the hosting fee rather than on lost revenue. A store losing orders for two hours does not get its orders back.
That is the real argument for monitoring: not to claim a refund, but to know quickly and act. Our roundup of hosting for high traffic covers the plans that stay up under pressure.
And our guide to setting up automatic backups covers the other half of being ready.
We run no tests and we do not rank monitoring software. The uptime figures quoted here come from our tables, each with its window and method.
Hostingstep provides the full-year 2025 record for SiteGround and the November 2025 to August 2026 window for Bluehost. The Scala Hosting and InterServer figures come from independent monitoring of live sites, which used UptimeRobot.
Where a provider publishes a figure nobody has verified, we record it as a company claim, as with the Hostwinds row. Where monitoring stopped, we note the date, as with Namecheap. Bluehost belongs to Newfold Digital. The criteria behind our scores are on our about page.
Uptime Monitoring FAQ
Yes. A host dashboard reports its own view and a vendor percentage is a claim. Two rows in our tables exist because somebody pointed UptimeRobot at live sites for twelve and eighteen months.
We do not rank monitoring software, because we price hosting. Compare check interval, number of locations, what the check requests, certificate expiry alerts and whether the alerts reach you.
For a small site, yes: five-minute checks from several locations with email alerts. Pay for shorter intervals, a public status page, longer history, or checks that log in and click something.
Because they describe different experiences. SiteGround recorded 99.96% with 193 minutes over 44 outages; Bluehost 99.99% across nine. Close percentages, very different weeks.
A page that queries the database rather than a cached homepage, the checkout or login for a store, and the certificate’s days remaining. A homepage check can pass while the database is broken.
The Verdict
Monitoring is the cheapest useful thing you can add to a website. The only reason our own tables can say anything about two hosts is that someone ran a monitor for a year or more.
Set up a free tier today, point it at a page that touches the database, add certificate alerts, and keep the history. Then judge your host on your own record rather than on a percentage from a marketing page. Our guide to fixing a website that is down covers the morning the alert arrives.