
Disclosure: WebFin is reader-supported. If you buy hosting through links on this page, we may earn a commission at no extra cost to you. Commissions vary between providers and our ratings do not — here’s our full disclosure.
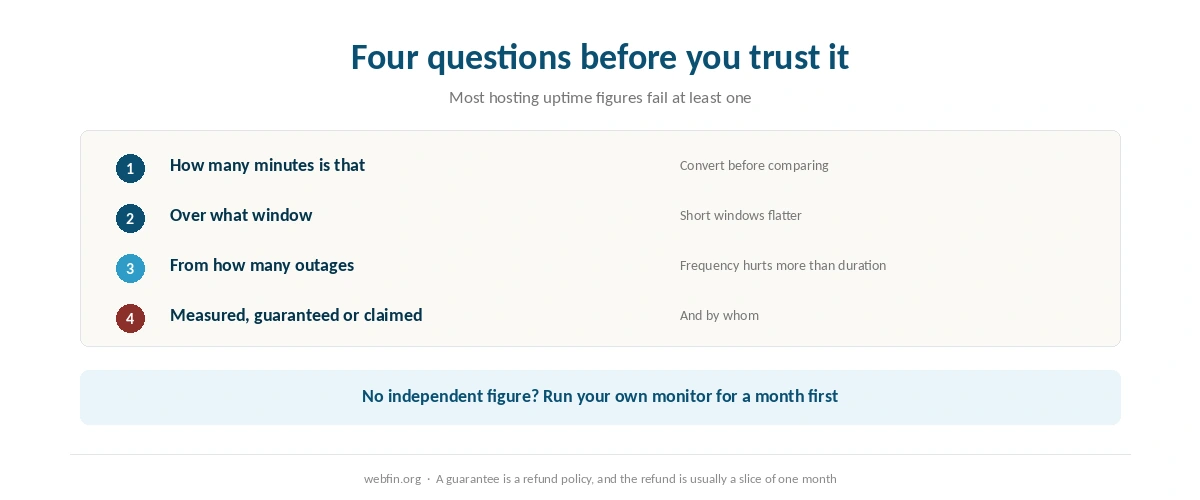
To read a hosting uptime report, turn the percentage into minutes, then ask four questions about where the number came from. Over how long a window? How many outages made up the total? Is it a measurement or a guarantee? And who published it? Most uptime figures in hosting marketing fail at least one of those. Here is why it matters: 99.96% and 99.97% look identical, yet in the 2026 benchmarks one of those figures hides 44 outages and the other hides seven. The other half of hosting evidence is covered in testing your site speed properly.
How to Read a Hosting Uptime Report: The Short Answer
Convert the percentage to minutes a year first. Then check the window, because short windows flatter. Count outages, not only the total. Treat any guarantee as a promise with a refund attached, not as a record. And trust a number more when somebody other than the host published it.
Step 1: Turn the Percentage Into Minutes
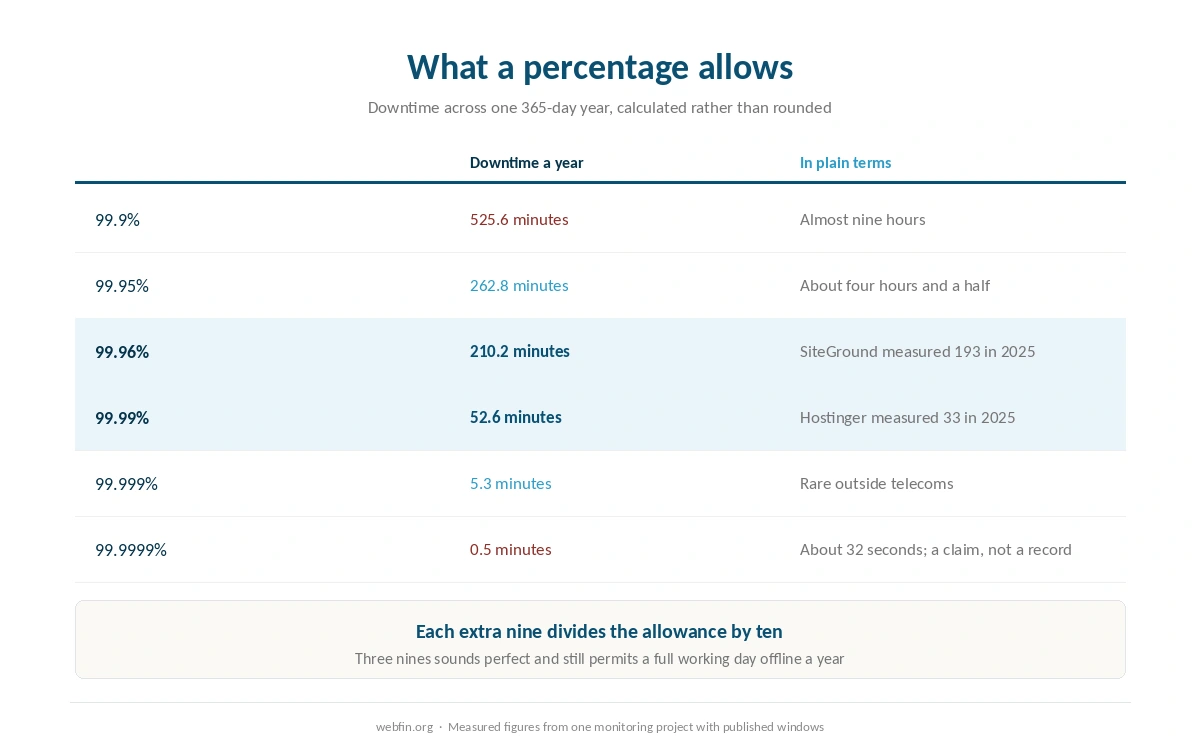
Percentages near 100 compress enormous differences into decimals. A year holds 525,600 minutes, so 99.9% allows 525.6 minutes of downtime, which is almost nine hours. At 99.99% the allowance falls to 52.6 minutes. At 99.999% it is barely five.
The conversion is the whole trick, and it is worth doing every time. A host that advertises 99.9% is promising you nearly nine hours a year offline, spread however the year falls. Put that way, three nines stops sounding like perfection. It is a full working day offline every year, or about an hour every six weeks.
Step 2: Find the Window
An uptime figure without a time window is not evidence. The shorter the window, the better a host tends to look, because one bad night either lands inside it or does not. Hostinger illustrates this neatly: Hostingstep records 99.99% across 2025, while HostPro Reviews, watching for six months, reported 99.93%.
Neither figure is wrong. They measure different stretches of time, and a buyer who sees only one of them gets a partial picture. When a review quotes uptime without saying how long it watched, treat the number as a sample, not a record. Our Hostinger review prints both windows side by side.
Step 3: Count the Outages, Not Only the Total
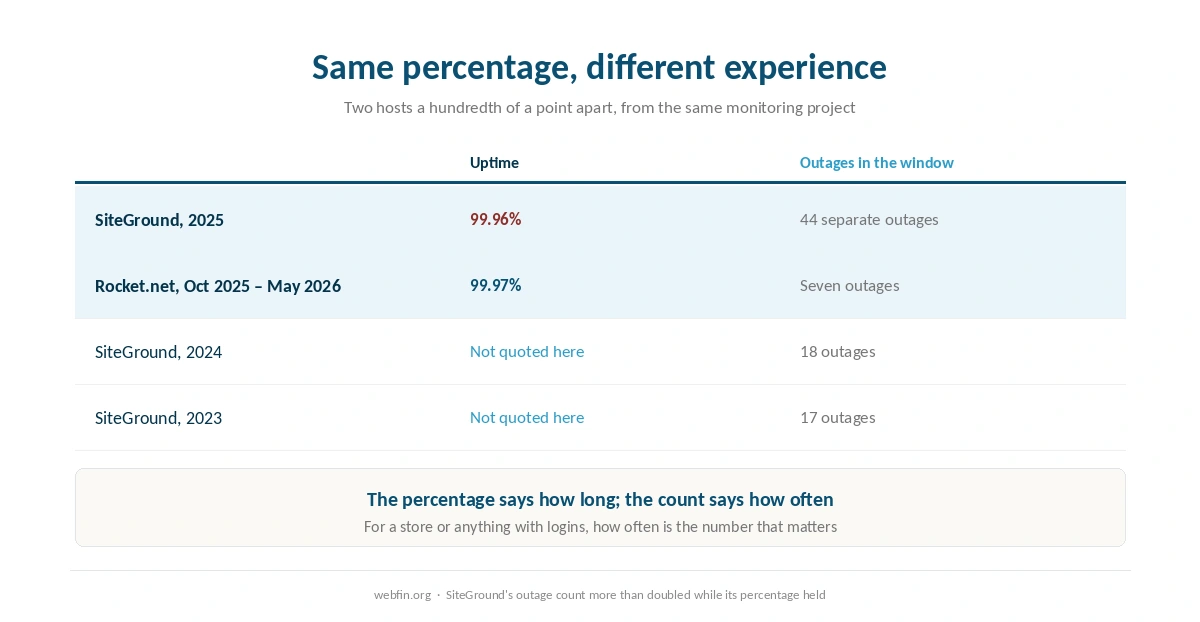
A percentage tells you how much time was lost. It does not tell you how often. SiteGround recorded 99.96% across 2025, which works out at 193 minutes, and those minutes came from 44 separate outages. Rocket.net recorded 99.97% over its window, and that came from seven.
Those two percentages differ by a hundredth of a point. The outage counts differ by a factor of six. For a store, a membership site or anything with logins, frequency matters more than duration, because every outage breaks sessions and abandons carts. SiteGround also shows a trend worth seeing: 17 outages in 2023, 18 in 2024, 44 in 2025. Our comparison of SiteGround against Rocket.net puts the two records next to each other, and our SiteGround review tracks the trend.
| Host | Measurement | Source and date |
|---|---|---|
| WP Engine | Global TTFB 65 ms, 1st of 34 hosts | Hostingstep, 2025 ranking, 40 locations |
| WP Engine | US TTFB 365 ms across 22 locations | Hostingstep, 2025 ranking |
| WP Engine | TTFB 355 ms, 349,920 checks | Hostingstep, Oct 2025 – May 2026 |
| WP Engine | Uptime 99.976%, 10th of 14 managed hosts | Study of 14 managed hosts, 2026 |
| WP Engine | Load 27 ms at 0% errors | Hostingstep, 2026 benchmarks |
| Rocket.net | Cached TTFB 85 ms globally | 12-month test, Mar 2025 – Mar 2026 |
| Rocket.net | Origin TTFB 310 ms; checkout bypasses cache | Same 12-month test |
| Rocket.net | Uptime 99.97%, seven outages in the window | Hostingstep, Oct 2025 – May 2026 |
| Rocket.net | Hardware score fell 8.5 → 7.5; not recommended | Hostingstep, 2026, tracked since Oct 2020 |
| Hostinger Business | Global TTFB 223 ms, 5th of 34 hosts | Hostingstep, 2026 |
| Hostinger Premium | Global TTFB 495 ms, 28th of 34; no CDN | Hostingstep, 2026 |
| Hostinger | TTFB 707 ms; server response 246 ms | Cybernews, June 2026 |
| Hostinger | Uptime 99.99%, 33 min down in 2025 | Hostingstep, continuous since 2021 |
| Hostinger | Uptime 99.93%, 6-month window | HostPro Reviews, 2026 |
| Hostinger | LCP 0.607 s, 2nd of 15 hosts | TechRadar, 10-week window, 2026 |
| Bluehost | Hardware score 9.6 of 10 | Hostingstep, 2026 |
| Bluehost | Load 41 ms at 0% errors after the Oracle move | Hostingstep changelog, 9 Jul 2026 |
| Bluehost | Response 411 ms; uptime 99.99% across 9 outages | Hostingstep, Nov 2025 – Aug 2026 |
| Bluehost | Global TTFB 224 ms across 40 locations, cached | Hostingstep Bluehost review, Jul 2026 |
| HostGator | Global TTFB 1.23 s; uptime 99.68%; 762 ms at 500 users | Hostingstep HostGator review, 2026 |
| HostGator | Hardware joint-highest in the field after the Oracle move | Hostingstep, 1 Sep 2026 update |
| ChemiCloud | US TTFB 531 ms; global 460 ms | Hostingstep, Oct 2025 – May 2026 |
| ChemiCloud | Load 1,068 ms at a 4.2% error rate | Hostingstep, same window |
| ChemiCloud | Uptime 99.76%; overall 6.1 of 10, degrading | Hostingstep, tracked since 2021 |
| GoDaddy shared | TTFB 751 ms; load test did not complete | Hostingstep, Nov 2025 – Jun 2026 |
| GoDaddy shared | Uptime 99.76% | Hostingstep, Nov 2025 – Jun 2026 |
| GoDaddy Managed WordPress | TTFB 344 ms; hardware 3.8 of 10 | Hostingstep, 2026 |
| GreenGeeks | TTFB 395 ms North America, 447 ms Europe | Long-term independent testing, 2026 |
| GreenGeeks | TTFB 580–610 ms Asia and Australia | Same testing window |
| GreenGeeks | Load 26 ms at 0% errors; WPBench 5.0 of 10 | Hostingstep, 2026 |
| GreenGeeks | 25 outages in the window; no integrated CDN found | Hostingstep, 2026 |
| Kinsta | Origin TTFB 525 ms; edge figures differ | Hostingstep, 2026 |
| Kinsta | Load 40 ms at 0% errors; WPBench 8.8 of 10 | Hostingstep, 2026 reviews |
| DreamHost | TTFB 450–500 ms band | Hostingstep, 2026 benchmarks |
| Scala Hosting | Uptime 99.97% across twelve months | Live site, 40,000 monthly visitors, UptimeRobot |
| Scala Hosting | 29 ms at the 95th percentile, 50 users | k6 load test, 2026 |
| InterServer | Uptime 99.98% across eighteen months | Six production sites, UptimeRobot |
| InterServer | Load under 700 ms; under 1.5 s by another source | Two 2026 reviews |
| A2 Hosting | TTFB 150–198 ms | 2026 studies; LiteSpeed on Turbo tiers |
| IONOS | Global TTFB 480 ms; WPBench 7.2 of 10 | Hostingstep, 2026 benchmarks |
| IONOS | Uptime 99.99%; load test failed at 65.4% errors | Hostingstep, 2026 benchmarks |
| Namecheap | TTFB 461 ms; global 448 ms; WPBench 5.0 | Hostingstep, Q4 2025; monitoring paused 30 Jun 2026 |
| InMotion | TTFB 300–500 ms shared | Published measurement, 2026 |
| InMotion | Uptime 99.97–99.99%; one account near 99.5% | Several 2026 sources |
| Hostwinds | No independent measurement found | 99.9999% is the company's own claim |
| Liquid Web | Not covered by the benchmarks we cite | VPS and dedicated are outside their scope |
| SiteGround | TTFB 632 ms; 22nd of 34 hosts | Hostingstep, 2026 benchmarks |
| SiteGround | Uptime 99.96% in 2025; 193 min over 44 outages | Hostingstep, full year 2025 |
| SiteGround | WPBench 8.4 of 10; load 170 ms at 0% errors | Hostingstep, Oct 2025 – May 2026 |
| Scala Hosting | TTFB 465 ms; global 501 ms | Hostingstep, 2026 benchmarks |
| Scala Hosting | WPBench 8.8 of 10; load 48 ms at 0% errors | Hostingstep, 2026 benchmarks |
| Scala Hosting | Uptime 99.98% across the year | Hostingstep, 2026 benchmarks |
| Cloudways | Vultr HF: load 288 ms at 1.7% errors; WPBench 7.6 | Hostingstep Cloudways review, 2026 |
| Cloudways | Uptime 99.996% to 99.999% across five plans | Hostingstep, Oct 2025 – May 2026 |
Step 4: Separate the Guarantee From the Measurement
An uptime guarantee is a contract term. It says what the host will refund if it misses a target, not what it achieved. Liquid Web, for instance, commits to 100% network uptime backed by service credits, which is a strong promise and still not a record. Our Liquid Web review explains what the credit covers.
Read the exclusions before the headline. Most guarantees leave out scheduled maintenance, attacks, and problems the host attributes to your own code. Many cover the network rather than the server, so a site that returns an error while the network stays up counts as available. The credit, when it arrives, is usually a slice of one month’s fee, which is small beside a lost day of sales.
⚠️ Then there is the claim with nothing behind it. Hostwinds advertises 99.9999%, which allows about 32 seconds of downtime a year, and no independent project we could find measures it. We record that as a claim rather than a figure, and our comparison of SiteGround against Hostwinds explains why a counted 99.96% is worth more.
Step 5: Check What Was Monitored, and How Often
A monitor checks a URL at an interval and records whether it answered. Both of those choices shape the result. A check every five minutes can miss a three-minute outage entirely, while a check every minute catches it. Ask what interval produced the number, because a coarse interval quietly rounds downtime away.
Ask what was checked, too. A monitor that requests the homepage and receives any response counts a cached error page as uptime. One that loads a real page and checks its content is harder to fool. And one location sees one route: a host can be reachable from Virginia and unreachable from Frankfurt at the same moment.
Step 6: Check Who Published It
A host’s own status page is useful for live incidents and weak as a record, because the company decides what counts as an incident and when one ends. An independent monitor with purchased accounts and a published method is stronger. A review that ran a single test is weaker than both.
This is why the numbers across this site come from one monitoring project with published windows, and why we name the window every time. Our guide to reducing TTFB applies the same rule to speed figures, which have the same weaknesses. Hosts that publish nothing at all are covered in our Hostwinds review.
What to Do If the Numbers Do Not Add Up
The review and the host disagree. Check both windows before deciding who is wrong. A shorter window usually explains it.
The percentage looks fine but the site keeps dropping. Count incidents rather than minutes. Frequent short outages hide well inside a good percentage.
Your own monitor says down and the host says up. Compare what each one checks. The host may be measuring the network while your monitor measures the page. If the site is down right now, our guide to fixing a website that is down starts with that exact test.
No independent figure exists. Say so, and run your own monitor for a month before committing to a long term. Free monitoring services exist, and a month of your own data beats a year of somebody else’s marketing. Our page on Cloudflare free against paid covers what the tiers change for an ordinary site.
How We Research
We run no uptime tests of our own. Every figure here comes from a named monitoring project with its window stated, mostly Hostingstep, and where a second project watched the same host for a different period we print both. A company’s own claim appears as a claim, with its source attached. Prices in the button captions come from the providers’ own pages, read on 20 September 2026. Our page on uptime monitoring covers why your own monitor beats any published percentage.
Minute conversions assume a 365-day year of 525,600 minutes, calculated rather than rounded from memory. The criteria behind our scores are on our about page, and the measured field sits in our roundup of the best WordPress hosting.
Uptime Report FAQ
About 525.6 minutes a year, which is almost nine hours. At 99.99% the figure falls to 52.6 minutes, and at 99.999% it is barely five. Converting to minutes is the quickest way to see what a percentage actually permits.
No. A guarantee is a contract term that says what the host refunds if it misses a target. Most exclude scheduled maintenance and attacks, and many cover the network rather than the server. The credit is usually a slice of one month’s fee.
Usually because they watched for different lengths of time. Hostinger reads 99.99% across 2025 in one project and 99.93% over six months in another. Shorter windows swing more, because a single bad night weighs more heavily.
For anything with logins or a checkout, the count. SiteGround recorded 99.96% across 2025 from 44 outages, while Rocket.net recorded 99.97% from seven. The percentages barely differ, and the experience of a visitor differs a lot.
Yes, especially when no independent figure exists for your host. Free monitoring services check a URL at set intervals and email you when it fails. A month of your own readings is better evidence than any claim on a pricing page.
The Verdict
An uptime figure is a sentence with most of its words removed. Put them back: how many minutes, over what window, from how many outages, measured by whom. Most numbers in hosting marketing survive one of those questions, and very few survive all four.
The practical rule is short. Prefer a counted figure with a window over a round figure without one, count outages when your site takes orders, and read a guarantee as a refund policy. If a host offers no independent record at all, make your own before signing for three years. Renewal prices deserve the same scrutiny, and our page on hosting renewal prices applies it.