
Disclosure: WebFin is reader-supported. If you buy hosting through links on this page, we may earn a commission at no extra cost to you. Commissions vary between providers and our ratings do not — here’s our full disclosure.
To check if your host is throttling you, look for three signs together. The first is a specific error when the site is busy. Next, your control panel may record the limits you reached. Finally, the slowness follows your own traffic rather than the time of day. Shared plans sold as unlimited still cap processor time, memory and the number of requests your site may handle at once. Reaching those caps is throttling in all but name, and the evidence sits in a panel that is easy to miss.
How to Check If Your Host Is Throttling You: The Short Answer
Watch for 508 or 503 errors at busy moments. Open the Resource Usage page in cPanel, if your host runs CloudLinux, and look for faults against processor, memory and entry processes. Compare slow periods with your traffic and rule out your own plugins and bots. Then ask support in writing for the limits on your account. During a spike the same faults appear, as how to handle a traffic spike covers.
What Throttling Looks Like
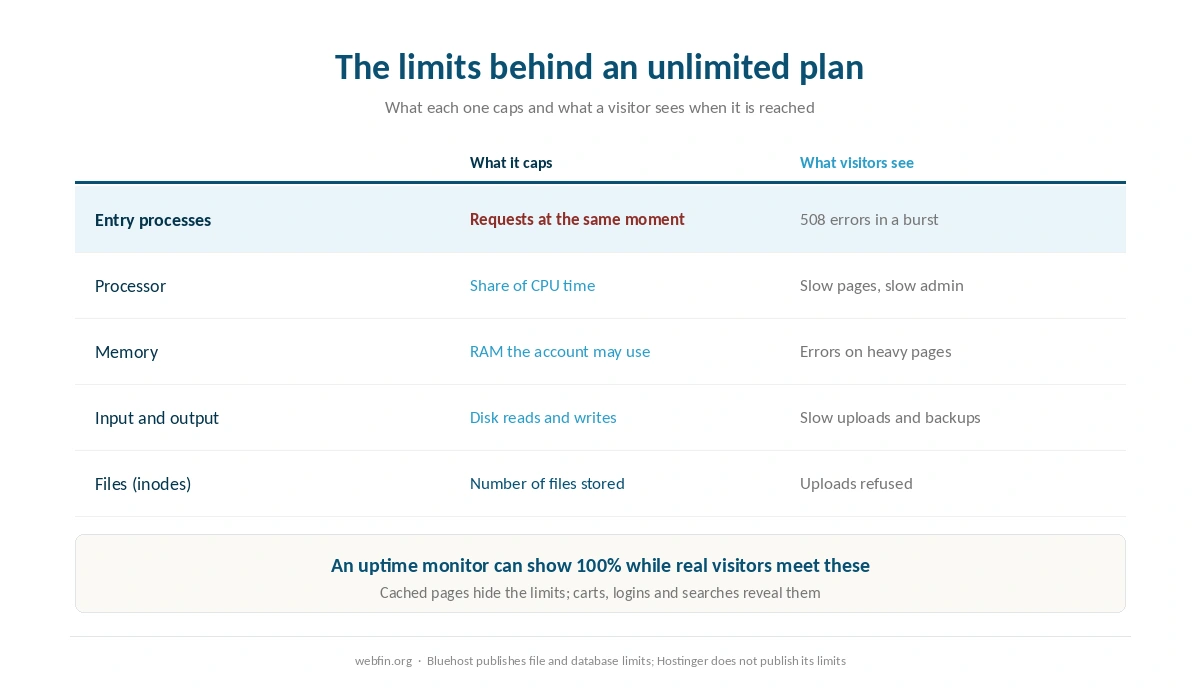
On shared hosting, throttling means something other than a slower connection. The host’s software stops your account from using more than its share of a server. On hosts that run CloudLinux, each account has limits on processor time, memory, input and output, and entry processes. Entry processes are the requests your site handles at the same moment.
When your account reaches a limit, requests wait or fail. The classic sign is an error page reading 508 Resource Limit Is Reached, and a 503 Service Unavailable page can have the same cause. The admin area slows first, because no page cache stands in front of it. If these errors appear during a newsletter, a sale or a crawl and vanish afterward, you are meeting a limit rather than an outage.
⚠️ Throttling is not the same as downtime. An uptime monitor that checks one cached page every few minutes can report 100% while real visitors meet errors on uncached pages. Our guide to reading an uptime report explains why one number cannot tell you both.
Step 1: Open the Resource Usage Page
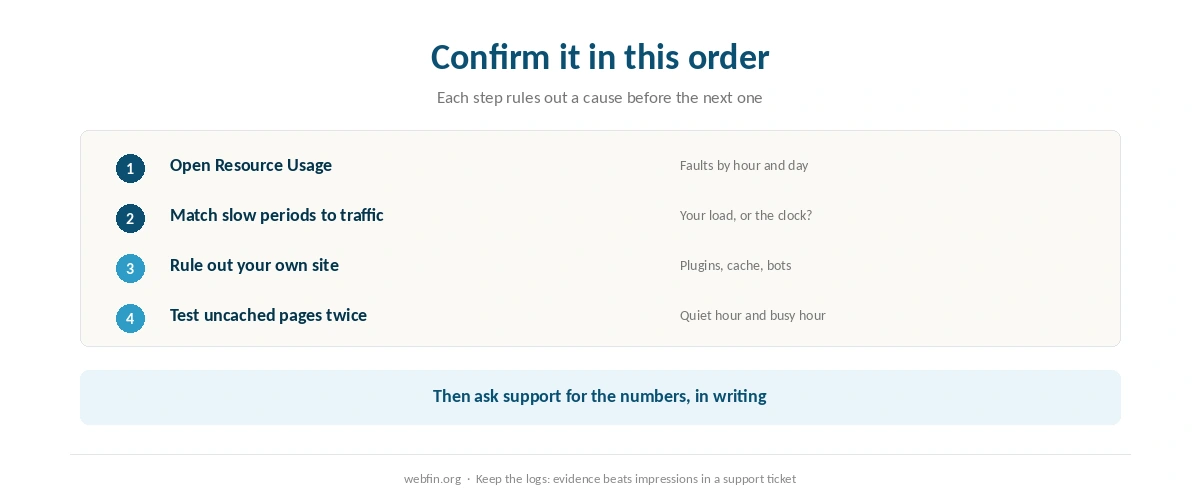
In cPanel on a CloudLinux host, the Resource Usage page shows your limits and every time you reached one. It keeps a history by hour and by day. A fault against entry processes means visitors queued or saw errors. A fault against processor or memory means pages slowed while the software held the account back.
Occasional faults during known busy moments are expected on a shared plan. Faults every day, or faults at quiet hours, point to a problem worth fixing. If your host does not show this page, ask for the figures. Our guide to understanding cPanel shows where it sits.
Step 2: Match the Slow Periods to Your Traffic
Throttling follows your own load, while a server-wide problem follows the clock. Open your analytics and your server access log for a slow period. Then ask what was happening: a spike in visitors, a crawler working through every page, or a backup or scheduled task running.
If slowness lines up with your own activity and with faults in the panel, the limit is the cause. If it happens at the same hours regardless of your traffic, the server itself may be overloaded. That is a different conversation with support.
Step 3: Rule Out Your Own Site
Before blaming the host, look at what your site asks of it. Heavy plugins, uncached pages, search and filter pages, and WordPress’s own scheduled tasks all draw on the same limits. Aggressive bots matter too: a crawler requesting hundreds of pages a minute can use up entry processes on its own.
Page caching, a content network and blocking abusive bots can remove the faults entirely. Our guides to reducing TTFB and setting up a CDN cover both.
Step 4: Test From Outside the Host
Measure time to first byte for an uncached page, such as a search result. Do it at a quiet hour and again at a busy one, from the same location. A large gap between the two, with no change to your site, fits the pattern of an account reaching its limits at the busy time.
A simple uptime monitor pointed at an uncached page adds evidence over days rather than minutes. Keep the results. A log of slow and failed checks at busy times turns a support conversation from impressions into evidence.
Step 5: Ask Support for the Numbers
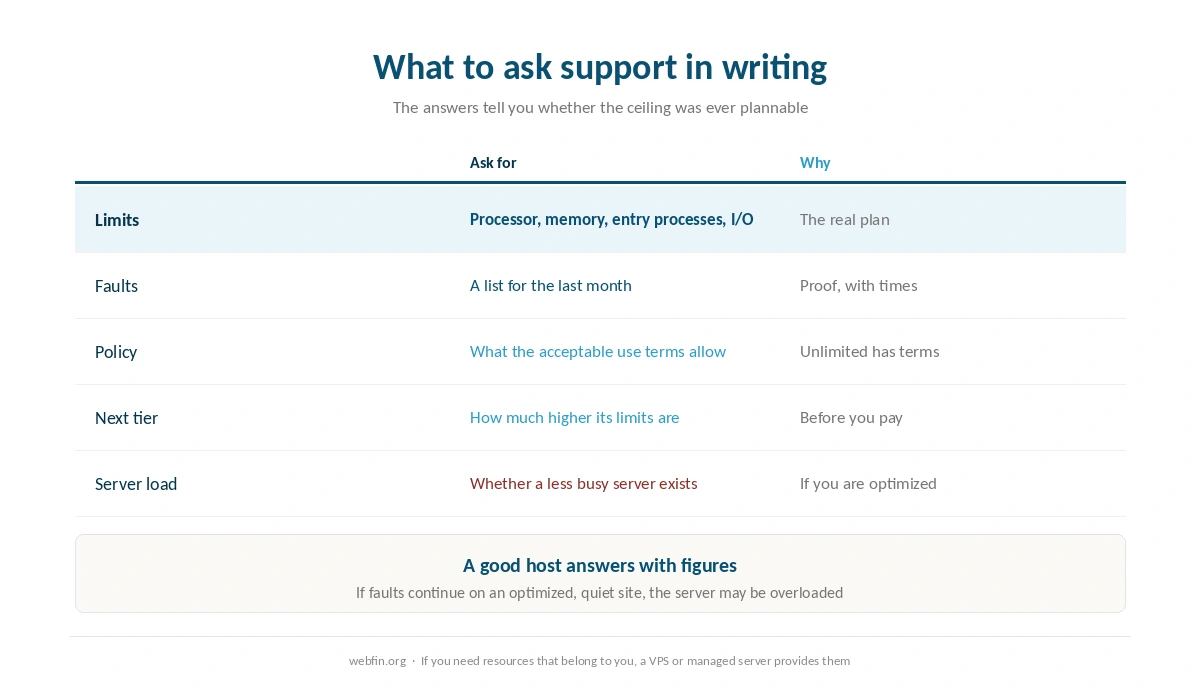
Ask in writing for the processor, memory, entry process and input-output limits on your account, and for a list of faults in the last month. A good host will answer with figures. The answer also tells you whether the plan you bought as unlimited has a ceiling you could have planned around.
Bluehost publishes some of these limits in advance, on files and databases. Its own help pages give 50,000 inodes as a soft limit and 200,000 as the acceptable use threshold. They also set 5 GB for a single database. Hostinger states in a support article that its limits are not published. Our piece on what unlimited hosting means collects what each host discloses.
| Host and plan | Limit | Where it's stated |
|---|---|---|
| Bluehost shared | 50,000 inodes — soft limit | Hosting Inode Limit article |
| Bluehost shared | 200,000 inodes — AUP threshold | Server Resource Limitations |
| Bluehost shared | 1,000,000 inodes — TOS violation | Hosting Inode Limit article |
| Bluehost shared | 5,000 tables or 10 GB, all databases | Server Resource Limitations |
| Bluehost shared | 5 GB per single database | Server Resource Limitations |
| Bluehost Starter | 100 MB per mailbox | Shared hosting prices page |
| WP Engine Startup | 25,000 monthly visits, then overage handling | Plan pages |
| WP Engine, by tier | 25,000 to 400,000 monthly visits | Plan pages |
| Rocket.net Starter | 25,000 monthly visits, 1 site, 10 GB storage | Plan pages |
| Namecheap EasyWP | 50,000 / 200,000 / 500,000 monthly visits by tier | Plan pages |
| Kinsta Starter | 25,000 monthly visits | Plan pages |
| Scala Hosting VPS | Priced per unit: $3 per core, $1 per gigabyte | Plan pages; adjustable anytime |
| HostGator shared | Weekly backups described as a courtesy, not guaranteed | Hosting terms |
| Liquid Web | Dedicated resources at every tier; no shared plan | Plan pages |
| InterServer Standard | Unlimited storage, bandwidth, email and websites | One plan, no tiers |
| GreenGeeks Lite | One website only | Plan pages |
| IONOS Plus | One email account bundled per plan | Plan pages |
| Hostinger, all plans | Not published | Hostinger support article, 28 Aug 2026 |
| Bluehost Starter | 10 GB NVMe storage | Plan pages, as listed in a 2026 audit |
| InMotion Core | One site, 10 email accounts, SSD storage; NVMe from Launch | TechRadar and a 2026 review |
| SiteGround shared | Shell access by tier — not recorded | Not stated on the plan pages we read, 20 Sep 2026 |
| Bluehost shared | Shell access by tier — not recorded | Not stated on the plan pages we read, 20 Sep 2026 |
| Hostinger, all plans | Shell access by tier — not recorded | Not stated on the plan pages we read, 20 Sep 2026 |
| Cloudways servers | Search service (OpenSearch, Elasticsearch) — not recorded | Not stated on the plan pages we read, 20 Sep 2026 |
Step 6: Decide Whether to Optimize, Upgrade or Move
Optimize if the faults come from your own site: caching, fewer heavy plugins, bot blocking. This costs nothing and may be enough.
Upgrade if the site has simply grown. A higher shared tier may raise the limits, and the host can tell you by how much before you pay.
Move if you need resources that belong to you. A VPS or managed server gives you a fixed share of processor and memory that no neighbor can borrow. Scala Hosting prices those by the unit, as our Scala Hosting review describes. Liquid Web sells dedicated resources on every managed tier, as our Liquid Web review covers. Our guide to moving from shared to VPS lists the signals.
Which Sites Meet the Limits First
A brochure site behind a page cache can run for years without a single fault, because most visitors receive a stored copy and the server barely works. A store, a forum or a membership site is different. Carts, logins and searches bypass the cache, so every one of those requests counts against the account.
Traffic that arrives in bursts matters more than traffic in total. A thousand visitors spread across a day rarely trouble a shared plan. The same thousand arriving within ten minutes of a newsletter can. Our roundup of hosting for high traffic ranks hosts by how they behave in exactly that moment.
What to Do If Support Denies It
Support says there are no limits. Ask what the acceptable use policy allows and what the Resource Usage page shows. An unlimited plan still runs under a policy.
Faults stop after you optimize. Your site was using more than its share, and the host was behaving as designed.
Faults continue on a quiet, optimized site. Ask to move to a less busy server, since this one may be overloaded, and keep your test logs.
The site goes down entirely. That is an outage rather than throttling. Our guide to fixing a website that is down starts with the checks that separate the two.
How We Research
This guide describes procedures rather than measurements, and it runs no tests. The error codes and panel pages described belong to standard cPanel on CloudLinux; hosts on other software show limits differently. Published limits come from the hosts’ own help pages, read on 20 September 2026, and sit in the table above.
The criteria behind our scores are on our about page. Our Bluehost review lists every limit Bluehost publishes, and Bluehost belongs to Newfold Digital.
Hosting Throttling FAQ
Look for 508 or 503 errors at busy moments, faults on the Resource Usage page in cPanel, and slowness that follows your own traffic rather than the time of day. The three together point to your account reaching its limits.
On hosts running CloudLinux, 508 Resource Limit Is Reached means your account hit one of its limits, often entry processes. Those are the requests handled at the same moment, and visitors see the error when too many arrive at once.
Unlimited plans still run under limits on processor, memory and simultaneous requests, and under an acceptable use policy. Storage or bandwidth may be unlimited in name while the host caps the resources that serve pages.
Yes. Heavy plugins, uncached pages, scheduled tasks and aggressive bots all draw on the same limits. Caching, a content network and bot blocking can remove the faults without any change of host.
When the faults continue after you optimize, and a higher shared tier would not cover your busiest hour. A VPS or managed server gives you a fixed share of processor and memory that no neighbor can use.
The Verdict
Throttling is rarely a mystery once you know where to look. The Resource Usage page records every limit you reach, your own traffic explains when, and a written answer from support gives you the numbers. Start with the fixes on your side: caching and bot blocking.
If those are not enough, the choice is between a bigger shared plan and resources of your own. Pick a host that tells you its limits before you need them, and move before the busiest day rather than during it. Our guide to migrating web hosting covers the move.